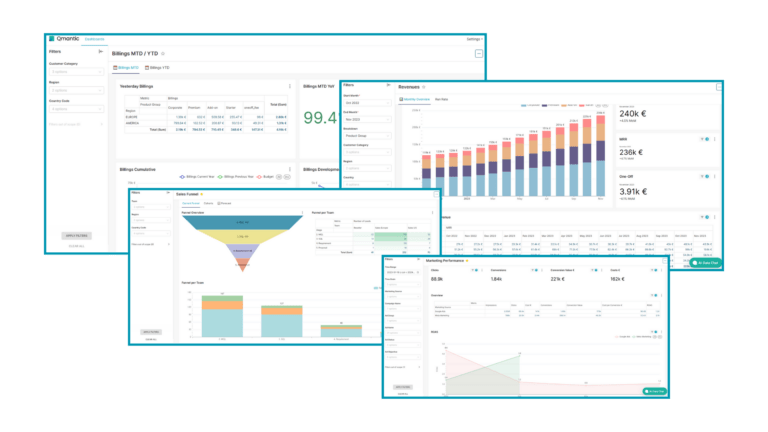
Dashboards and Reporting Templates
Optimize business performance with intuitive dashboards. Select the right report for Finance, Sales, and Marketing visualization.
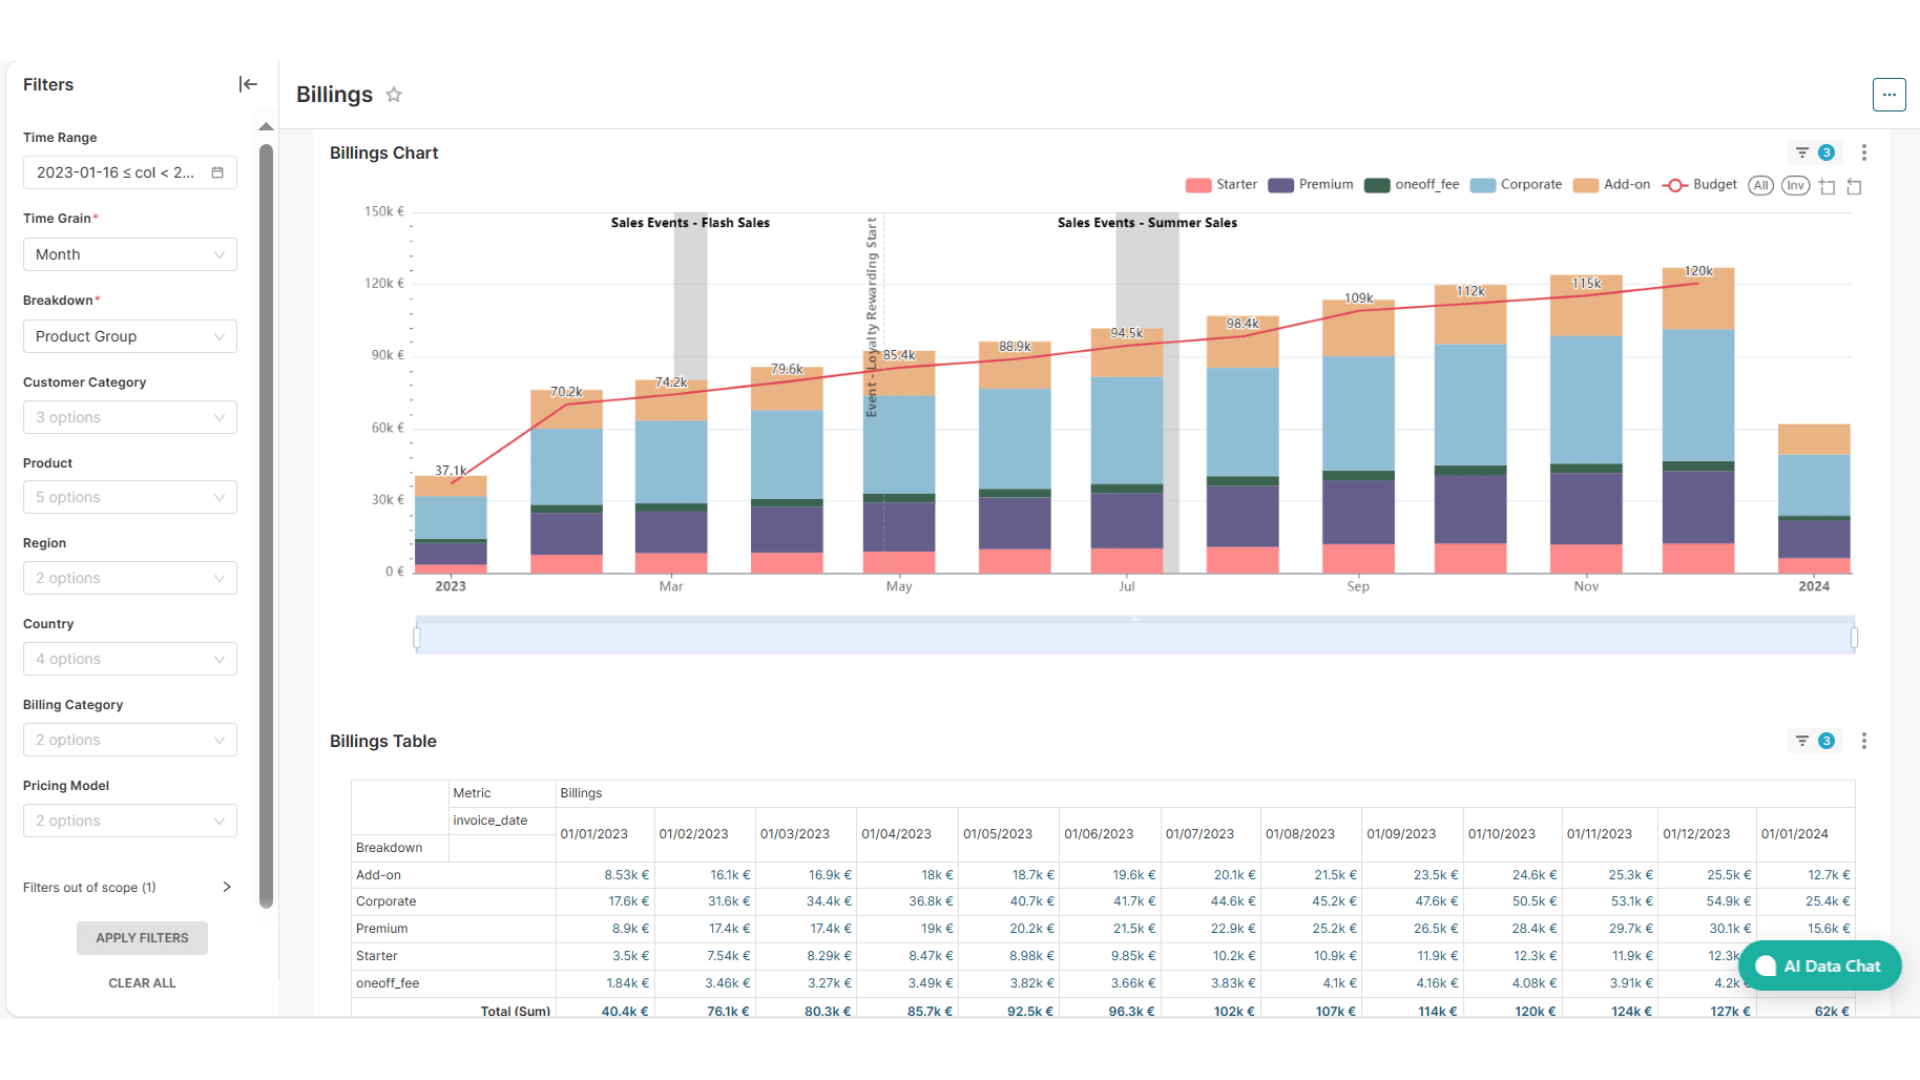
Billings
The Billing Dashboard provides a quick snapshot of billing trends with a visual chart and detailed table. Users can assess year-over-year growth and percentage comparison to the budget.
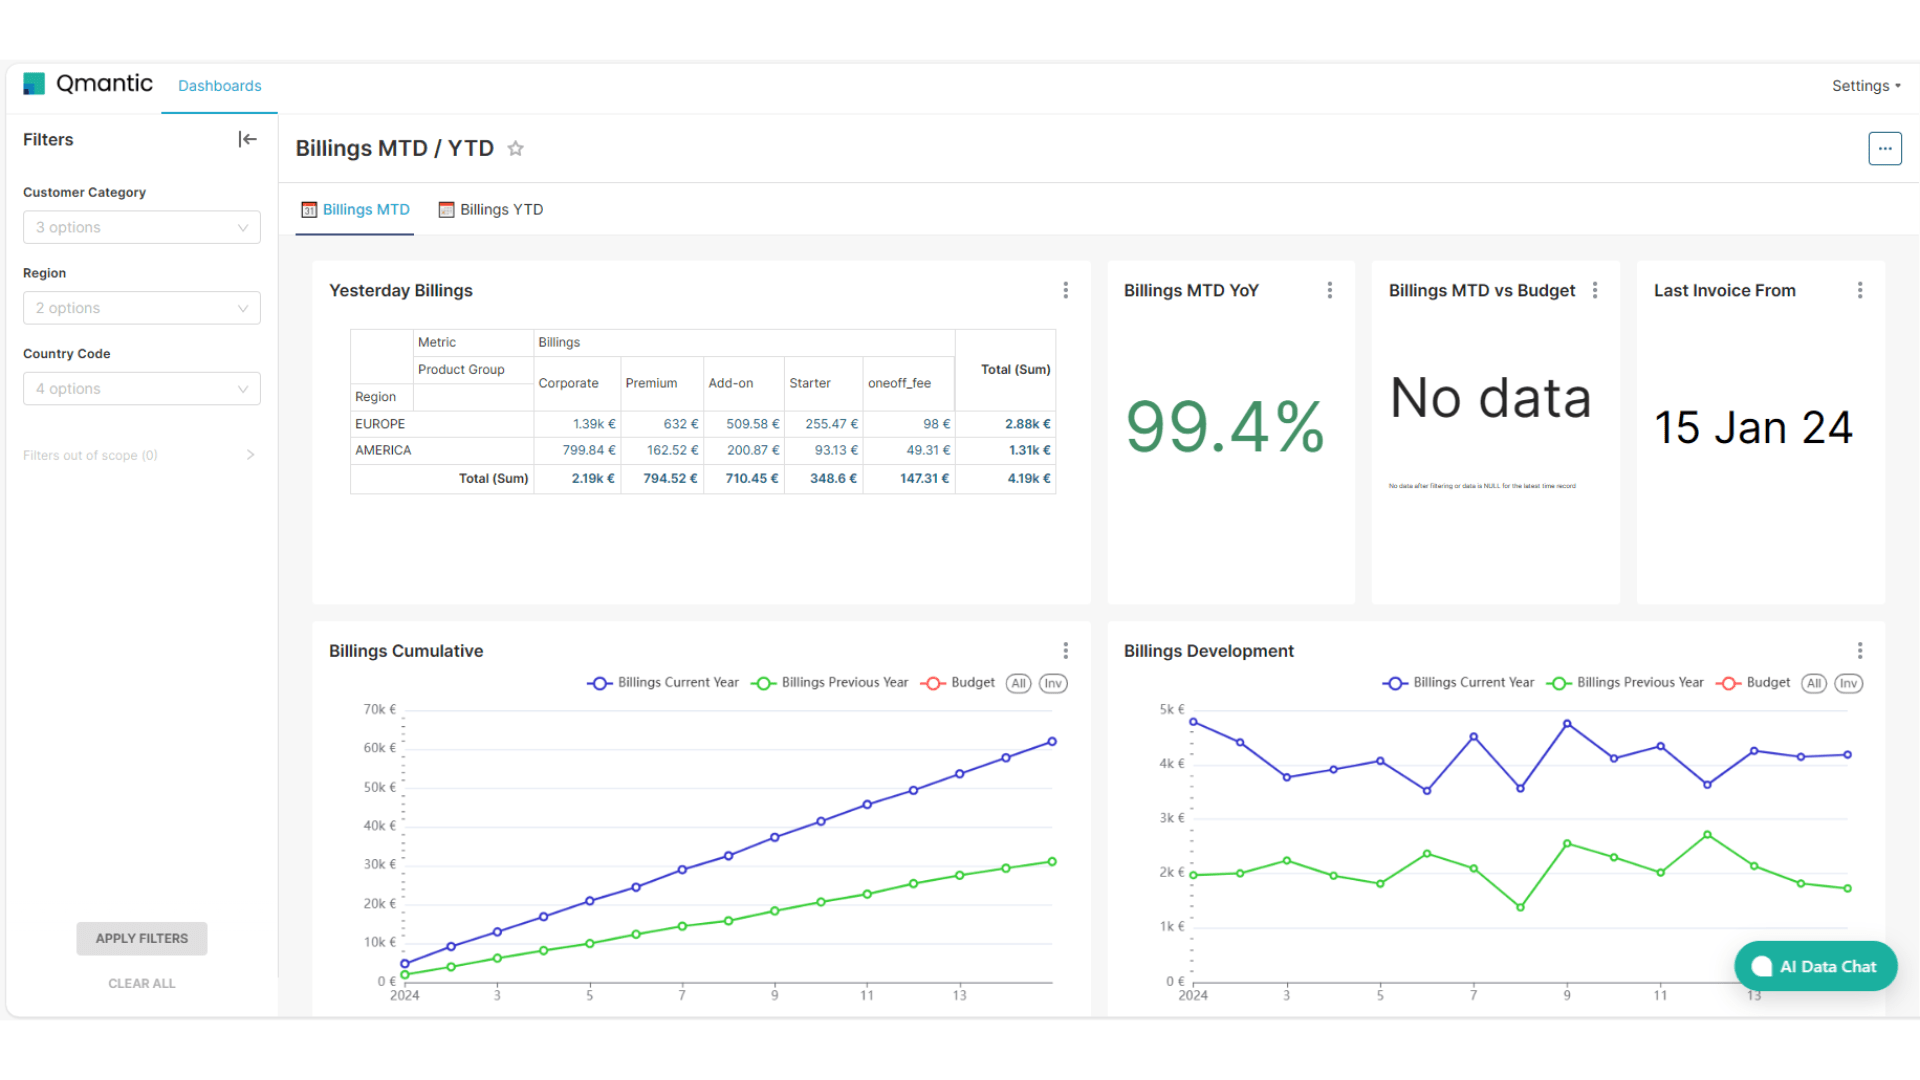
Billings MTD / YTD
Elevate your financial monitoring with the Billings MTD / YTD Dashboard. Gain real-time visibility into yesterday’s billings, compare current month’s performance with the previous year. This tool is optimal for financial performance.
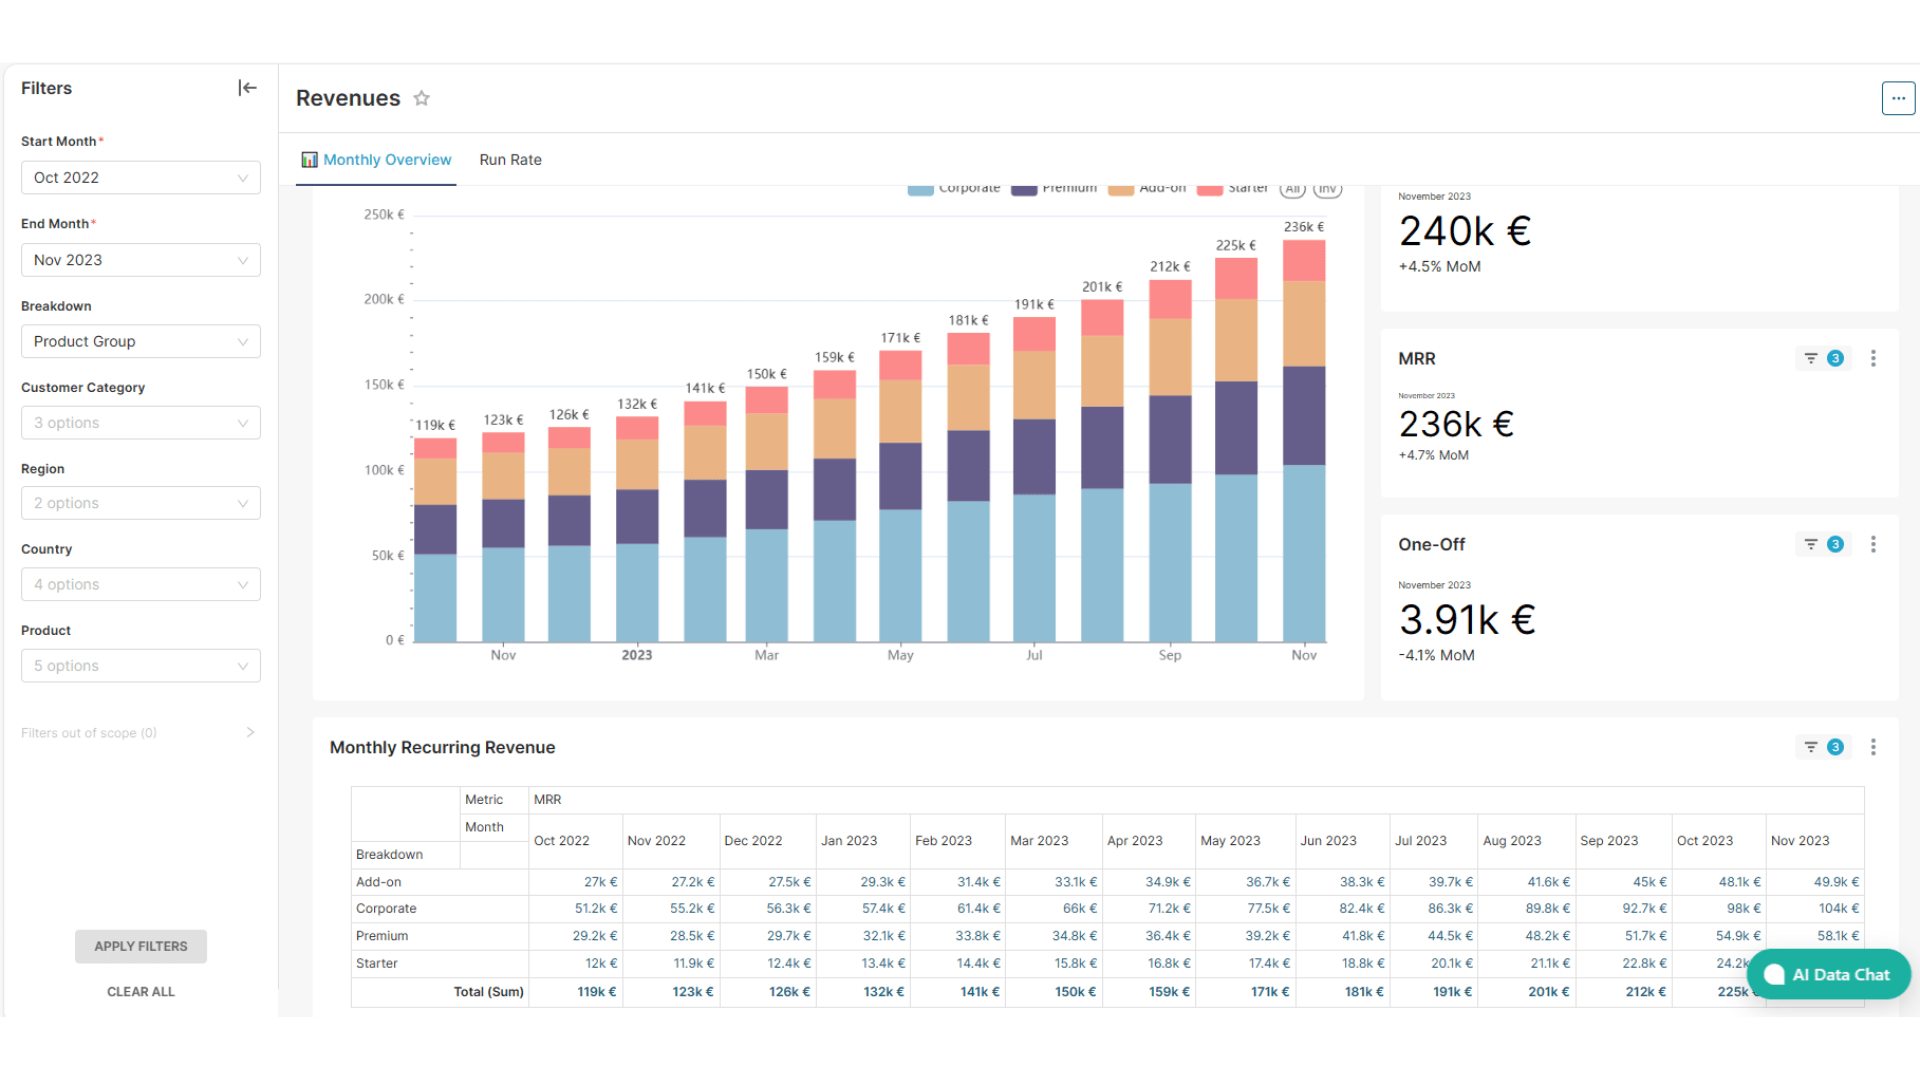
Revenues
The Revenues Dashboard is essential for a quick overview of the company’s financial performance, highlighting monthly revenue trends and the composition of Monthly Recurring Revenue and One-Off revenue.
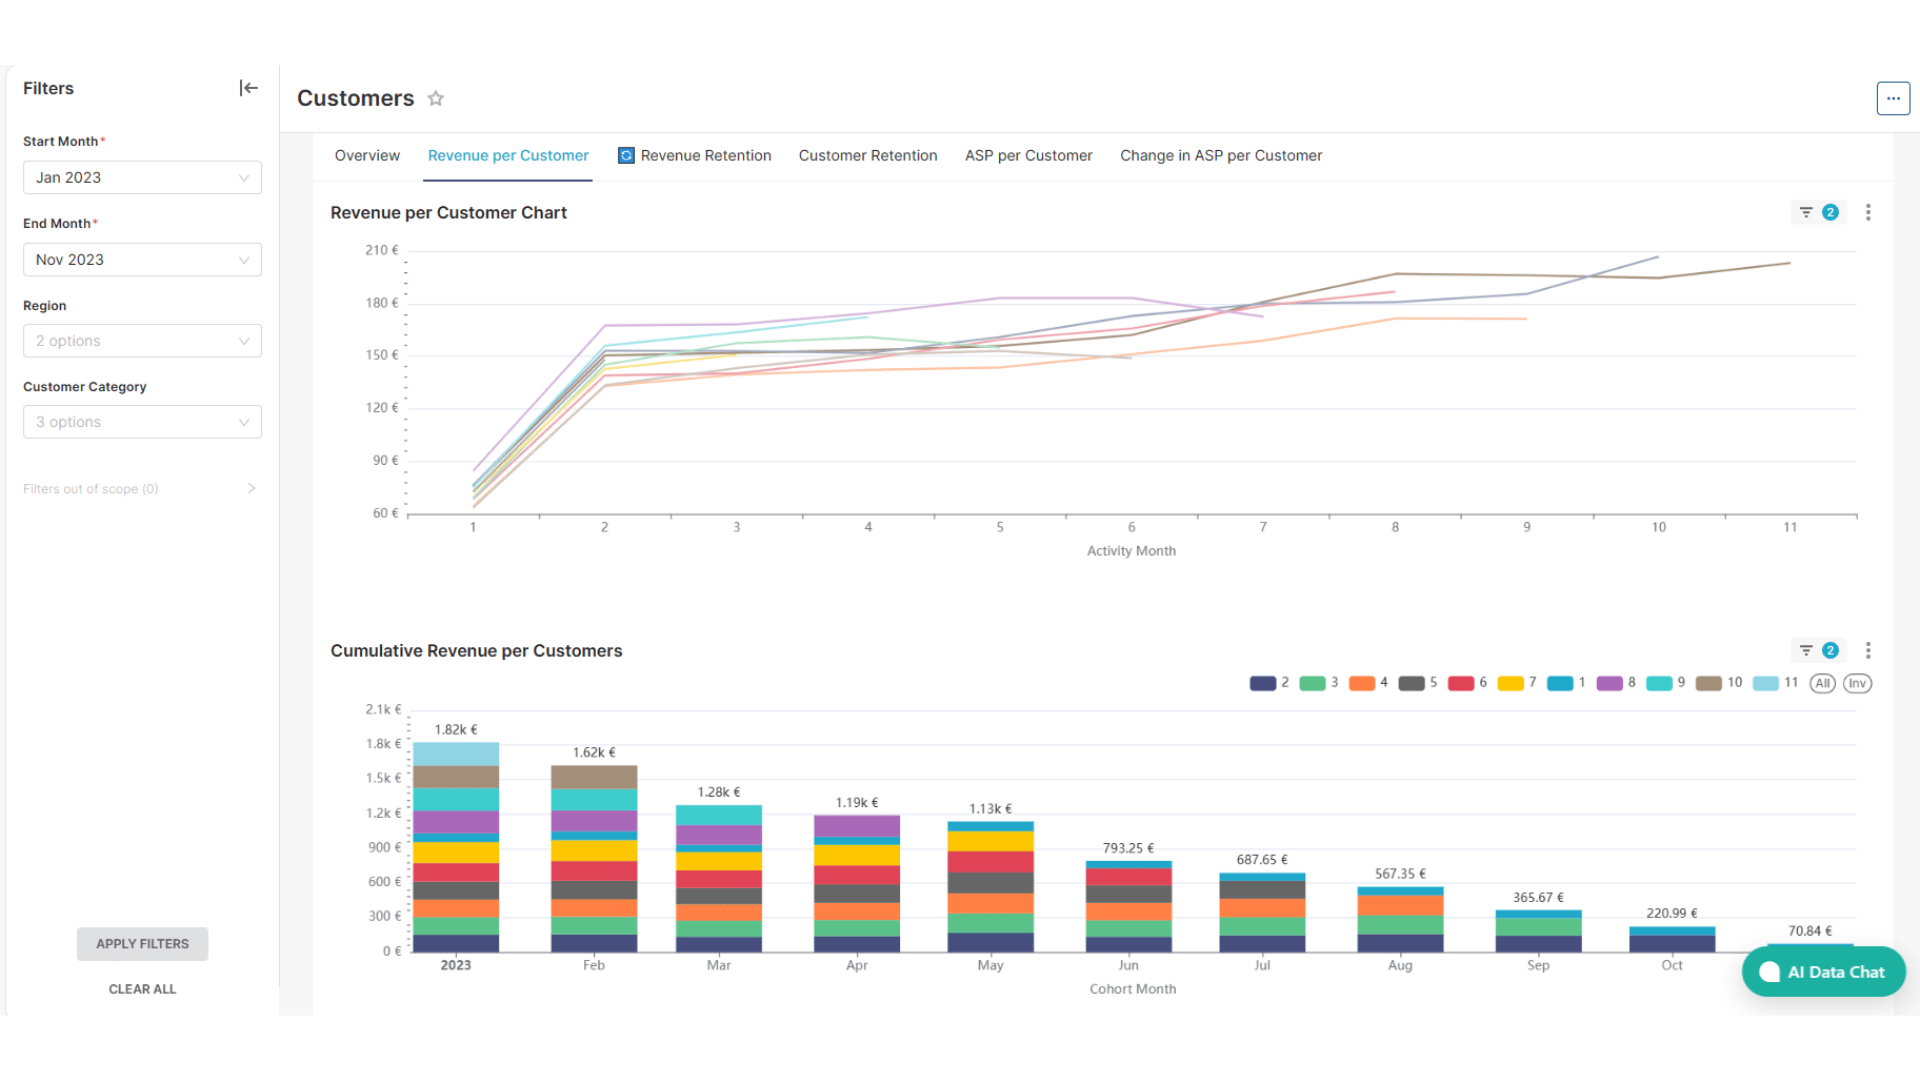
Customers
The customer dashboard is essential for tracking monthly revenue trends, understanding average revenue per customer changes, and assessing the impact of customer churn on retained revenue.
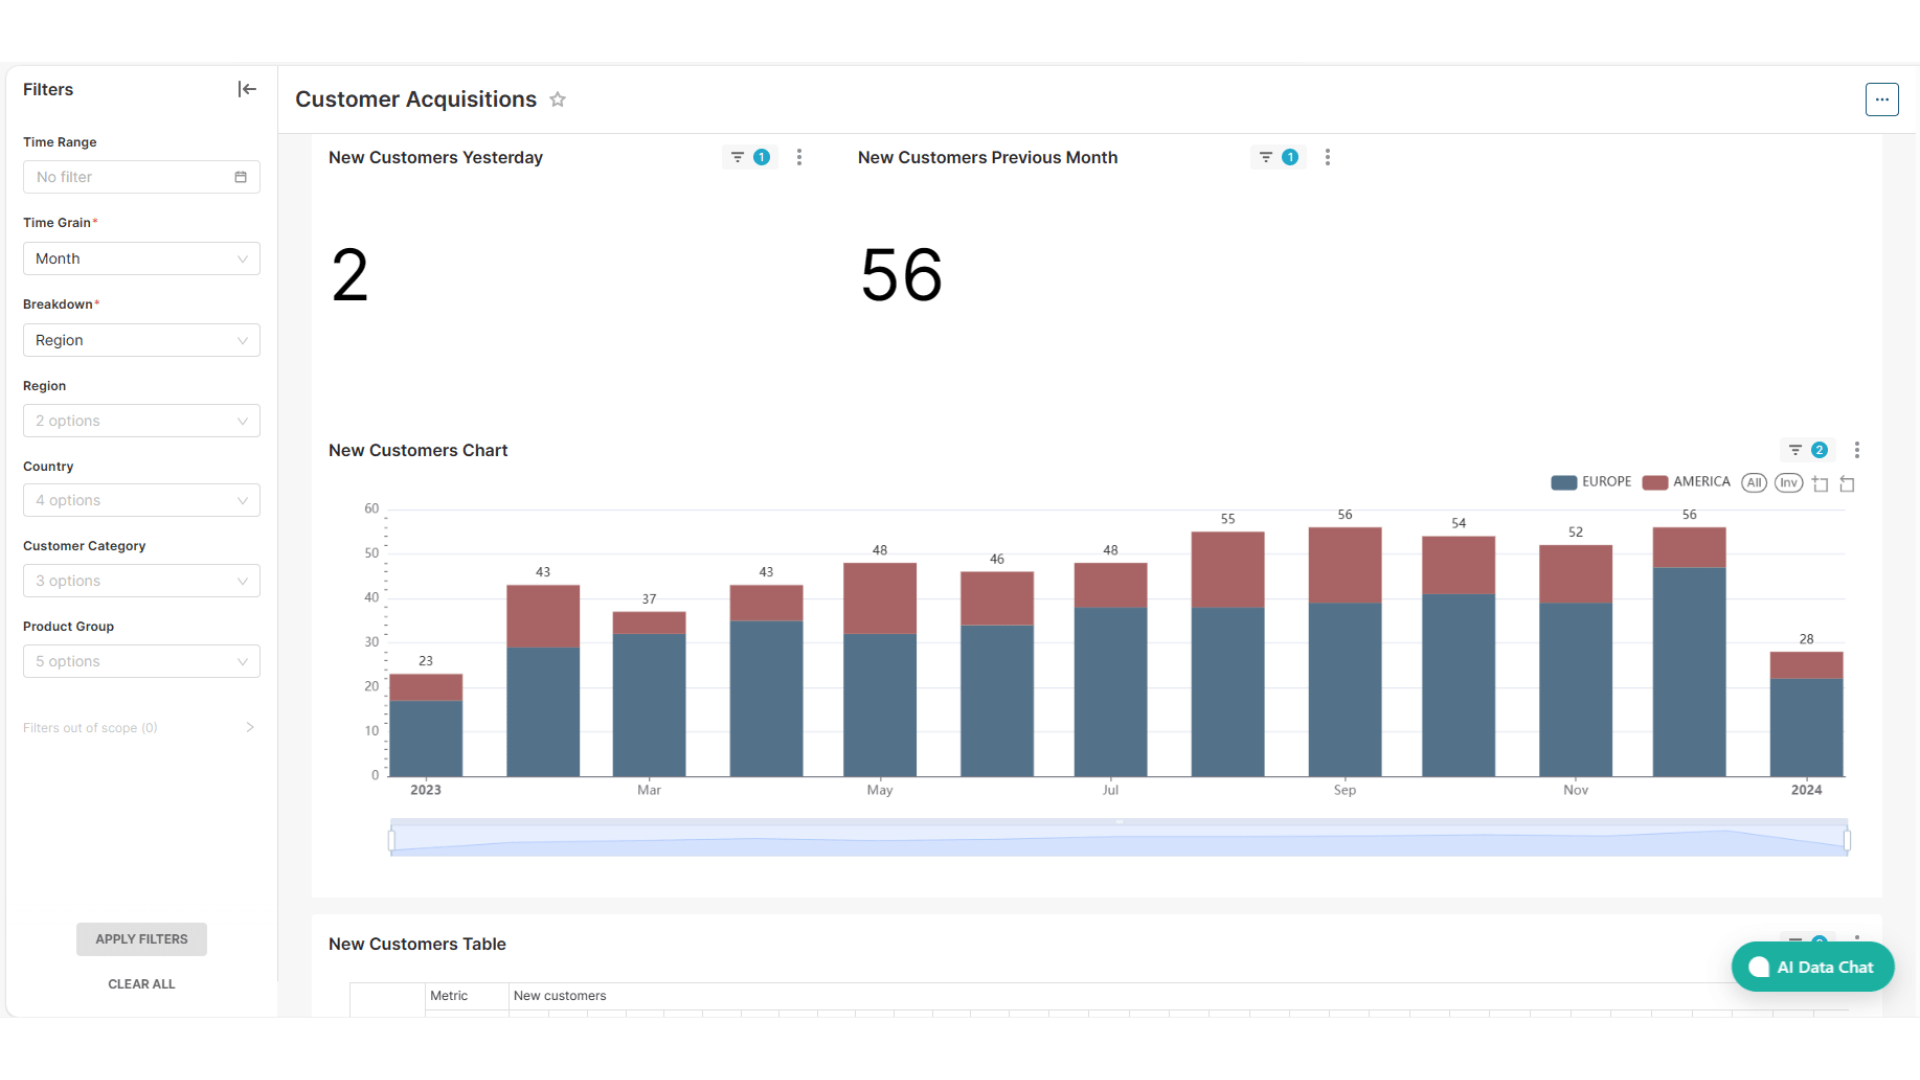
Customers Acquisition
The ‘Customer Acquisitions’ dashboard is crucial for businesses, offering a flexible overview of new customers, visual tracking of sales performance, and a quick analysis of year-over-year growth.
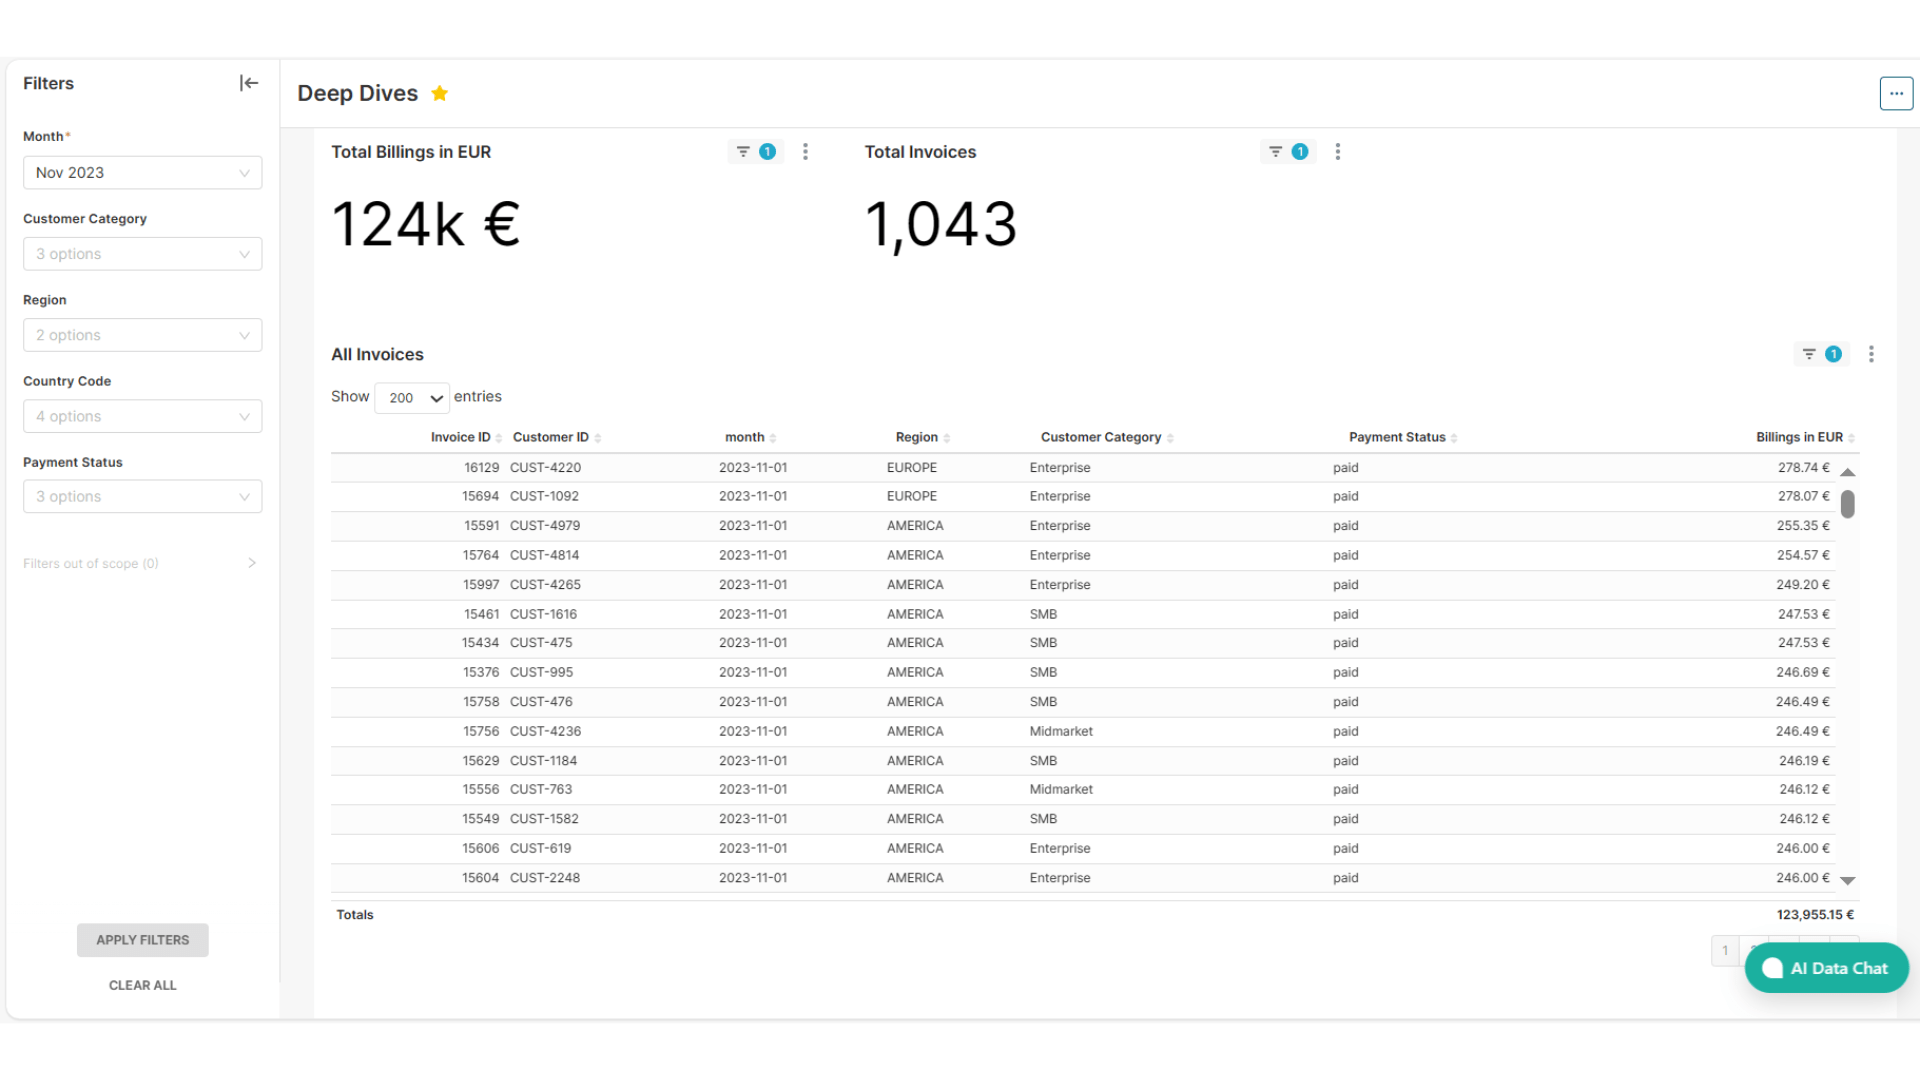
Deep Dives
The Deep Dives dashboard offers comprehensive insights into the financial and customer aspects of the business, with a focus on billing, customer acquisition, and churn. This dashboard provides at-a-glance visibility into KPIs.
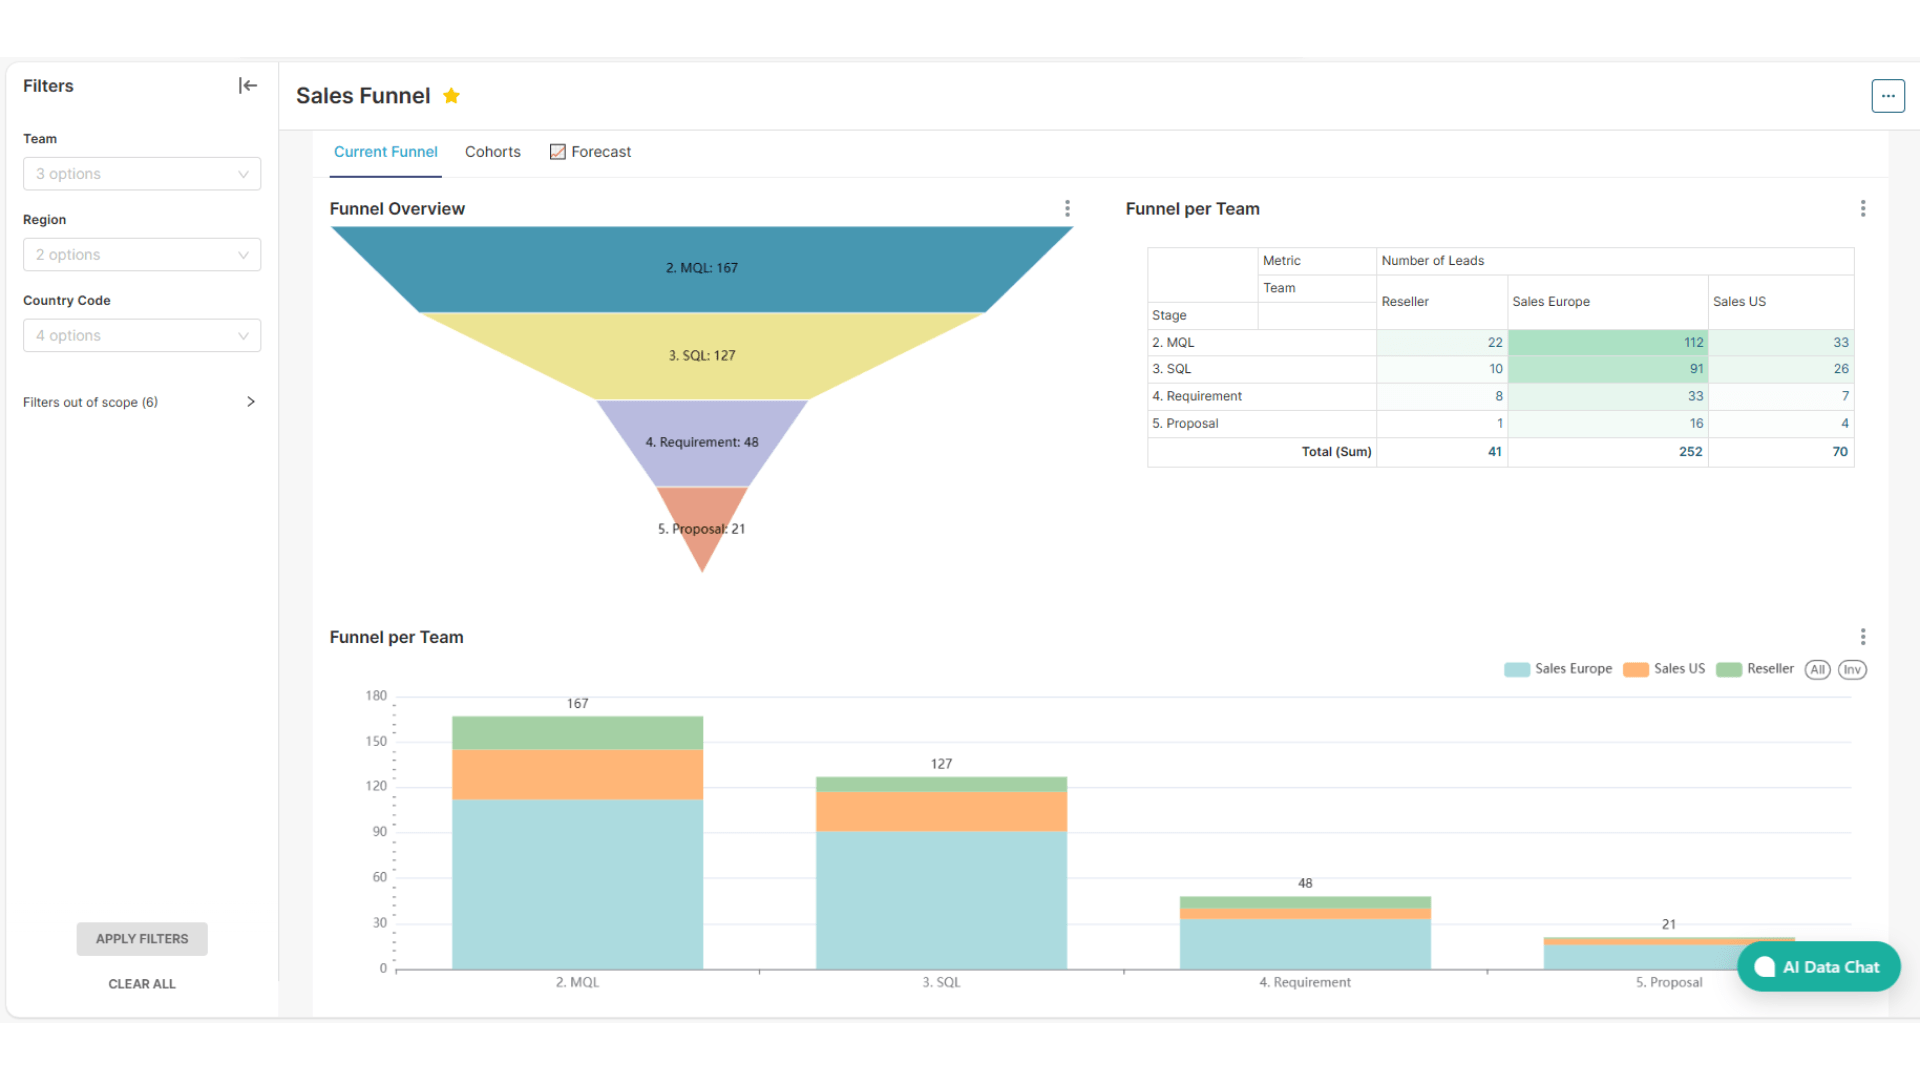
Sales Funnel
The Sales Funnel Dashboard is indispensable for sales teams, offering immediate insights into lead distribution, team performance, and the progression over time. Funnel Dashboard a vital tool for optimizing sales strategies.
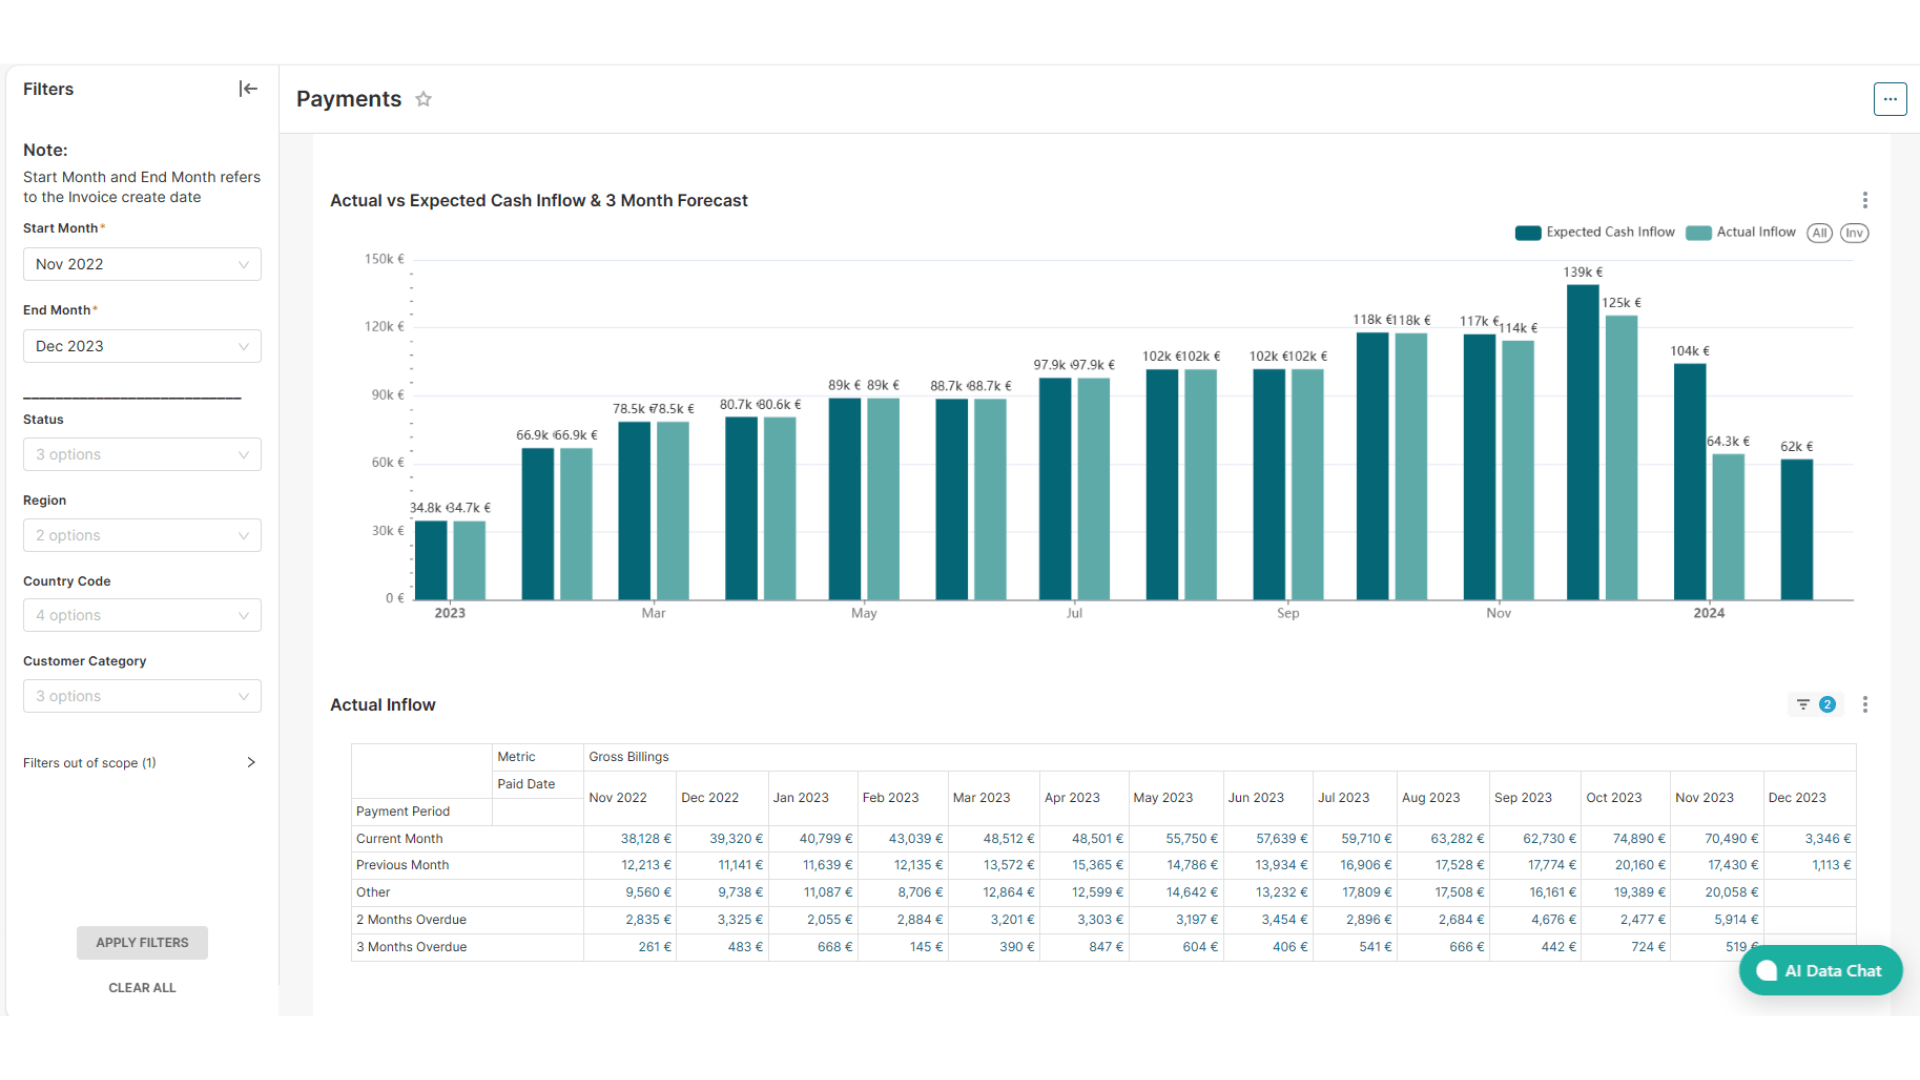
Payments
The Payment Dashboard is crucial for financial management, offering key metrics like Gross Billing and Days Receivable Outstanding to track cash flow. The dashboard compares real cash inflow with projections, aiding financial analysis and decisions.
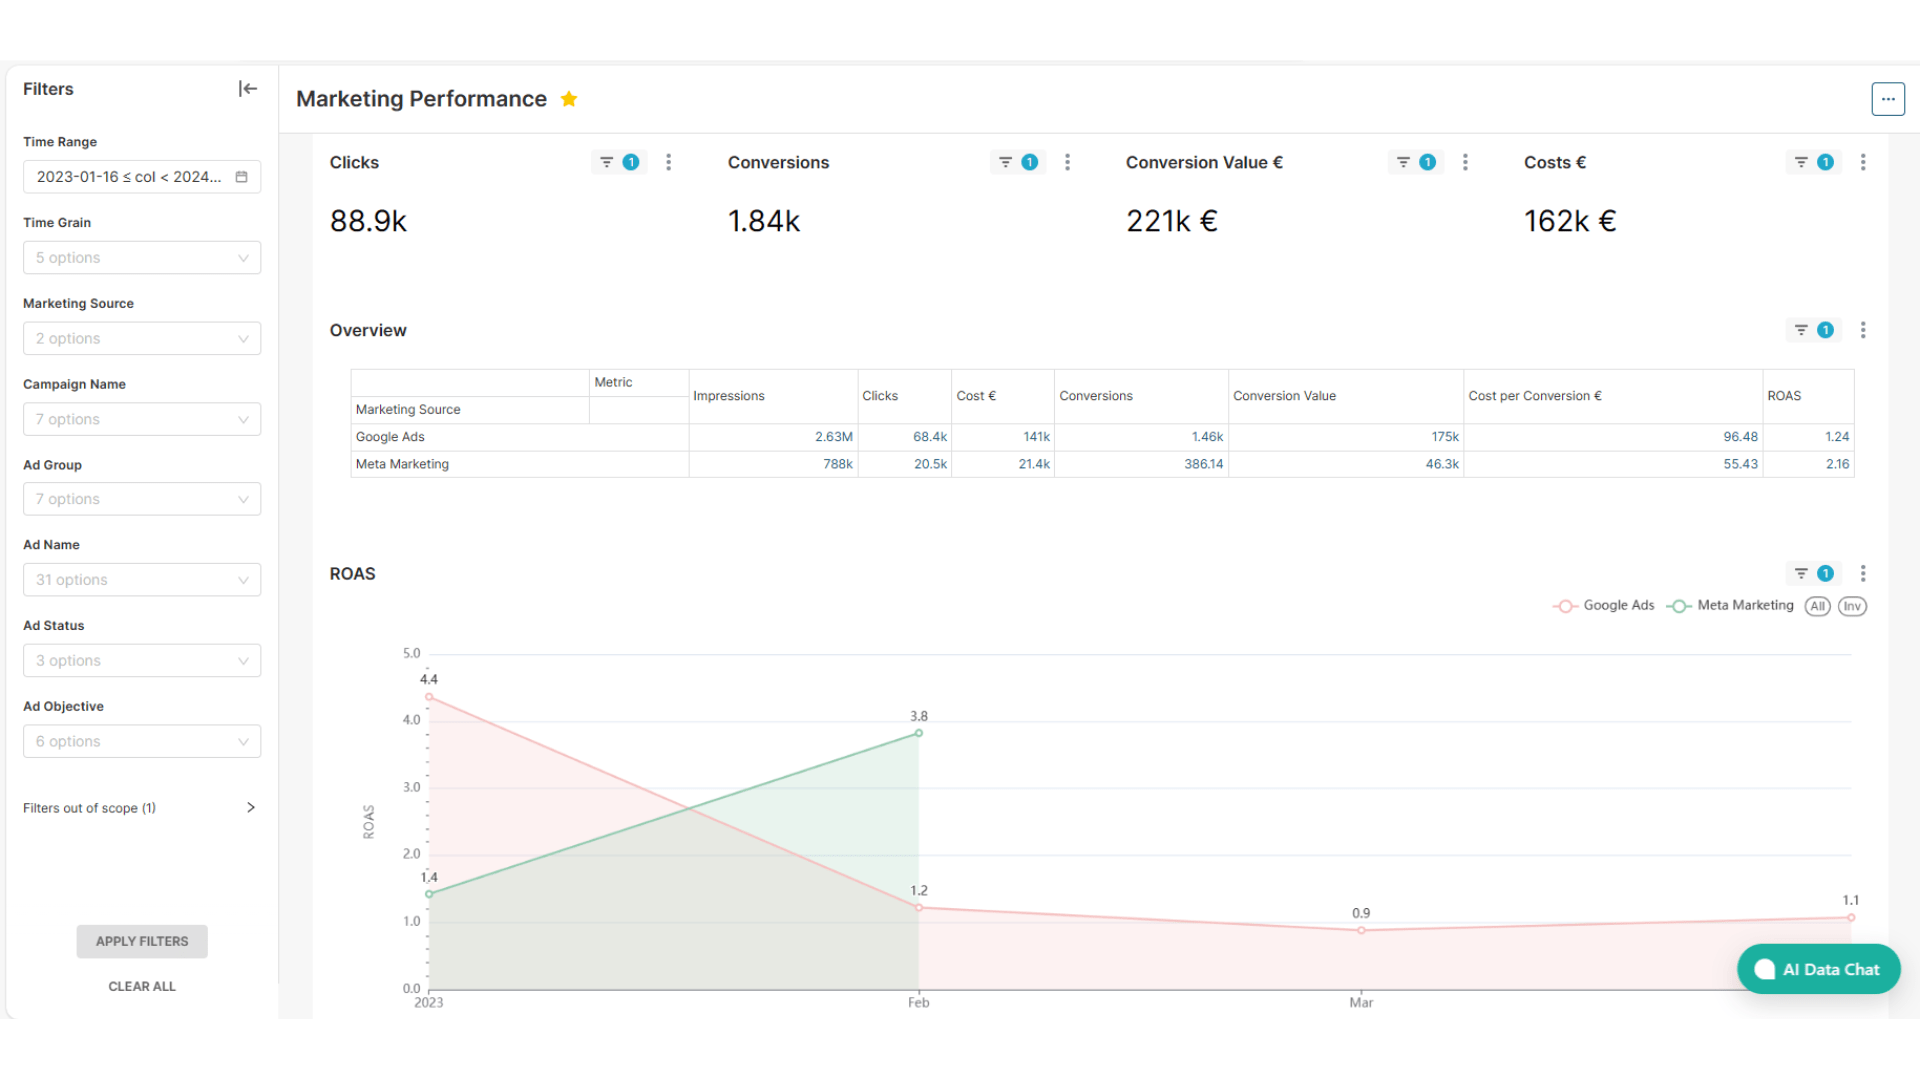
Marketing Performance
The Marketing Performance Dashboard allows for efficient comparison of channel metrics, monitoring of KPIs and detailed analysis of specific campaign elements like Campaign Name, Ad Group, Ads, and Keywords.

Interested to learn more about our AI Data Assistant? Contact us!
I agree to receive email communications from BI2Value GmbH. See our Privacy Policy for more details.