Data Availability Services
Get the data out of the silos
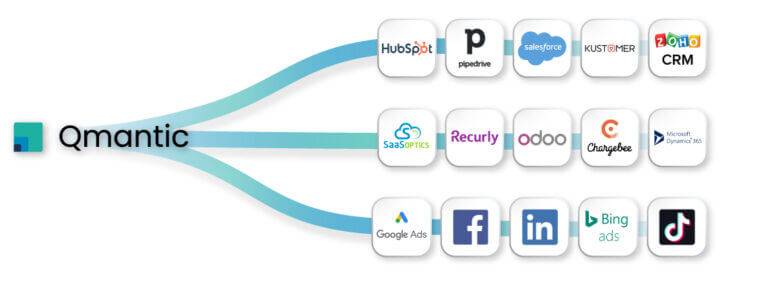
Does your important business data scatter across multiple applications and databases? Accessing it can be a challenging task, even with APIs. However, using a CSV file as a solution may seem time-consuming and requires starting from scratch whenever updates are needed.
Luckily, we have the perfect solution for you. Our Data Availability Service simplifies the data access process, eliminating complexities. So, just by sending an email or making a quick call to our experienced data engineers and analysts, we will efficiently assess your requirements.
From there, we will establish robust data pipelines and a reliable data warehouse, ensuring your data is always accessible – complete, connected, and up-to-date.
Moreover, our comprehensive service empowers analysts, data scientists, marketing professionals, and finance experts to effectively utilize your data.
Even individuals with basic SQL knowledge can seamlessly dive in and start working with the data. Connect your data effortlessly to powerful visualization tools like Qmantic Reporting Suite or data notebooks such as Jupyter, unlocking actionable insights.
Don’t hesitate to reach out today and share your plans and needs with us. Experience the true potential of your data with our Data Availability Service.
If you’re in need of a powerful solution to visualize this data, be sure to check out our Reporting Suite.
Let's get started!
How do we start working together ?

Initial Call
Once you reach out to us, we will schedule a call to understand your needs and requirements.

You get a proposal
Based on your input, we will send you a detailed proposal, including the pricing.

Implementation
You and your team will be able to test everything before you make a decision.


