In the dynamic realm of data management, the decision-making process for businesses stands at a crossroads, contemplating the choice between Microsoft Excel and Business Intelligence (BI) tools. Moreover, as companies grapple with the intricacies of data handling, a fundamental question emerges: should they adhere to the well-established comfort of Excel or embrace the cutting-edge analytics and visualization capabilities offered by Business Intelligence?
Unveil the procedural steps to extract data from Excel, craft dynamic dashboards, and delve into the transformative advantages of Business Intelligence. Together, let’s unleash the complete potential of turning your Excel into a BI dashboard.

Overview
- Excel vs. BI – Pros and Cons Evaluation
- How to pull the data from Excel to BI
Excel vs. BI – Pros and Cons Evaluation
In the dynamic landscape of data management and analytics, the choice between Microsoft Excel and Business Intelligence (BI) tools is a pivotal decision for businesses aiming to extract meaningful insights from their data. Additionally, these two contenders, each with its unique set of capabilities, present distinct advantages and challenges. As organizations navigate the complexities of handling data, the question arises:
Given the choice between relying on the tried-and-true familiarity of Excel or embracing the advanced analytics and visualization prowess of Business Intelligence, this exploration delves into the pros and cons of each. By shedding light on their respective strengths and limitations, it ultimately aids businesses in making informed decisions that align with their data-driven objectives.
Pros and Cons of Excel and BI
| Aspect | Microsoft Excel | Business Intelligence (BI) |
|---|---|---|
| User Interface | ✔ Familiar and user-friendly interface. | ✔ Intuitive dashboards for data visualization. |
| ✘ Limited capacity for complex data analysis. | ✘ May have a steeper learning curve for beginners. | |
| Data Analysis | ✔ Suitable for small to medium-sized datasets. | ✔ Powerful analytics capabilities for large datasets. |
| ✘ Slower performance with extensive datasets. | ✘ Requires skilled professionals for optimal use. | |
| Automation | ✔ Offers basic automation through macros. | ✔ Advanced automation with scheduled updates and alerts. |
| ✘ Limited automation compared to BI tools. | ✘ Automation features may vary among BI platforms. | |
| Collaboration | ✔ Widely used, fostering easy collaboration. | ✔ Facilitates collaboration through shared dashboards. |
| ✘ Simultaneous editing can lead to version issues. | ✘ Licensing costs may limit access for collaboration. | |
| Scalability | ✔ Suitable for small to medium-sized businesses. | ✔ Scales well to handle the growth of data and users. |
| ✘ Limited scalability for large enterprises. | ✘ Costs and complexity may increase with scalability. | |
| Data Visualization | ✔ Basic charts and graphs for visualization. | ✔ Advanced visualizations for better insights. |
| ✘ Limited compared to BI tools’ visualization. | ✘ Steeper learning curve for creating complex visuals. |
How to pull the data from Excel to BI
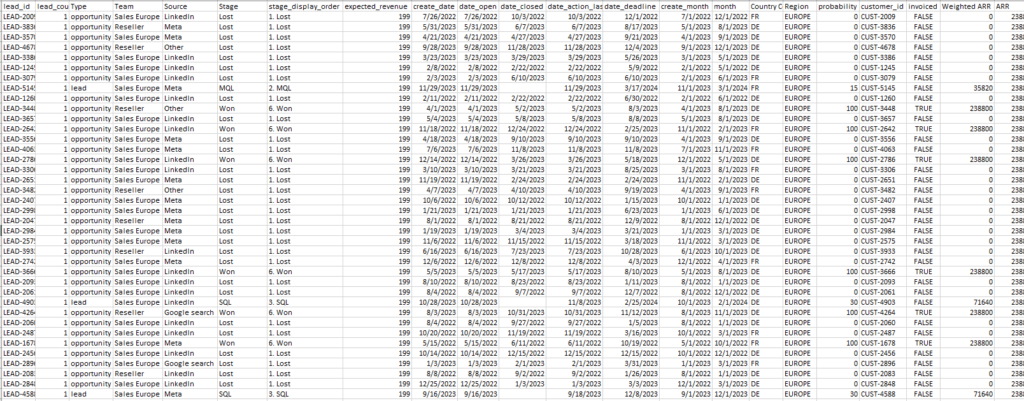
Step 1 – Gather Raw Data in Excel
Firstly, start by identifying the raw data you have in Excel. This could be customer information, billings, revenues, leads, or any other relevant dataset. Recognize the challenges associated with managing and analyzing data in Excel, such as manual processes, limited scalability, and potential errors due to manual data entry.
Step 2 – Save as CSV for Qmantic Integration
To enhance the manageability of your data, save the Excel file as a CSV (Comma-Separated Values) file. This format is widely supported and ensures a smooth integration with Superset. By converting the data to CSV, you’re preparing it for more advanced analysis and visualization.
Step 3 – Connect Excel Data to Qmantic
For business users transitioning from spreadsheets, Qmantic offers a straightforward method to use spreadsheets as sources for datasets. This user-friendly approach eliminates the need for upfront involvement from centralized data teams, allowing users to expedite their analytics initiatives.
Google Sheets Integration
Connecting Google Sheets as a data source is a breeze with Qmantic. Users can establish this connection effortlessly through a few clicks within the product UI. Notably, the live data feed ensures that datasets originating from Google Sheets are automatically updated whenever modifications are made to the source sheets.
CSV File Uploads
Qmantic introduces a unique feature by enabling users to directly upload CSV files without the necessity of connecting to any databases. This capability stands out from open-source alternatives like Apache Superset, where uploading CSV files typically requires prior data connections. This streamlined process in Qmantic provides users with added flexibility and ease of use in incorporating CSV data into their datasets.
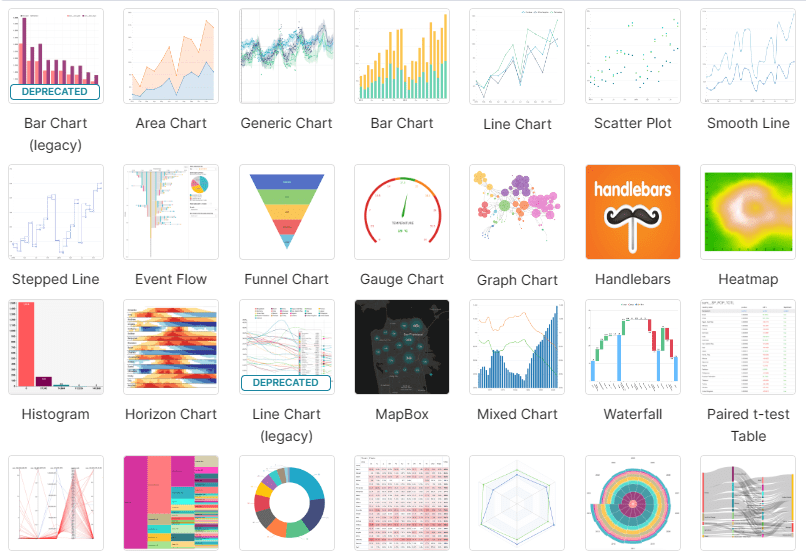
Step 4 – Create Dynamic Dashboards
Lastly, with the Excel data now integrated into Qmantic, explore the full range of features to create dynamic dashboards. Qmantic allows you to visually represent your data in charts, graphs, and other interactive elements. Showcase how Qmantic’s intuitive interface empowers users to transform the static Excel information into dynamic, user-friendly dashboards.
Additional Insights
Highlight the benefits of using Qmantic such as real-time data exploration, the ability to drill down into specific details, and the option to easily share insights with others in the organization. Emphasize how Qmantic enhances the overall data analysis experience compared to traditional Excel methods.
By following these steps, users can seamlessly transition from raw data in Excel to insightful and dynamic dashboards in Qmantic, overcoming the limitations of manual Excel processes and unlocking the full potential of their data.
Using Qmantic Sales Dashboard Template
For those looking to expedite the transition from Excel to Business Intelligence, Qmantic offers a Sales Dashboard template. This template streamlines the process, providing a pre-designed framework that caters specifically to sales-related data. Furthermore, by leveraging this template, users can effortlessly visualize key performance indicators (KPIs), track sales trends, and gain valuable insights into their sales processes.
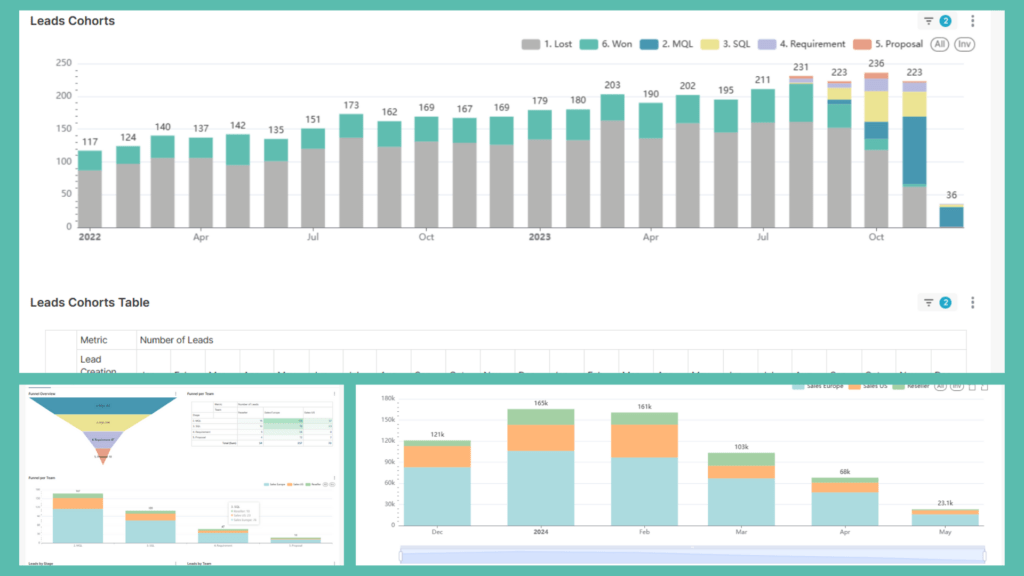
The Qmantic Sales Dashboard template comes equipped with interactive features, allowing users to drill down into specific metrics and explore the nuances of their sales data. Also, with a user-friendly interface, even those new to Business Intelligence can swiftly navigate through the dashboard, making it a valuable asset for sales teams aiming to enhance their decision-making processes.
Pros and Cons of Switching to Business Intelligence
Making the transition from traditional data management tools, like Microsoft Excel, to Business Intelligence (BI) tools represents a strategic shift for organizations aiming to unlock the full potential of their data. Here, we explore the pros and cons of embracing BI tools, shedding light on the transformative benefits and potential challenges businesses may encounter.
✔ Enhanced Data Analysis Capabilities
BI tools excel in handling large and complex datasets, offering powerful analytics capabilities that surpass the limitations of Excel. This enables businesses to extract more meaningful insights from their data.
✔ Advanced Data Visualization
BI tools provide sophisticated visualization options, empowering users to create compelling and interactive dashboards. This goes beyond the basic charts and graphs available in Excel, offering a more comprehensive representation of data.
✔ Improved Automation
BI tools offer advanced automation features, including scheduled updates and alerts. In addition, this ensures that data is always up to date, enhancing overall efficiency compared to the more manual processes in Excel.
✔ Scalability
Unlike Excel, which may face limitations with extensive scalability, BI tools are designed to scale seamlessly with the growth of data and users. This scalability is crucial for large enterprises with expansive datasets.
✔ Facilitated Collaboration
BI tools facilitate collaboration through shared dashboards, allowing teams to work collaboratively on data analysis projects. This is a significant advantage over Excel, where simultaneous editing can lead to version control issues.
✘ Learning Curve
BI tools may have a steeper learning curve, especially for users accustomed to the simplicity of Excel. However, this challenge can be mitigated through user training and familiarization sessions.
✘ Skill Requirements
To harness the full potential of BI tools, businesses may need skilled professionals who understand the intricacies of data analysis and visualization. This contrasts with Excel, which is widely used and familiar to many.
✘ Licensing Costs
While some BI tools offer cost-effective solutions, licensing costs may still be a consideration, especially for small businesses with budget constraints. However, the long-term benefits often outweigh the initial investment.
Transform Your Insights: Excel to BI with Qmantic

In conclusion, navigating the transition from Excel to Business Intelligence (BI) opens a gateway to enhanced data insights and transformative decision-making. The comparison of Excel and BI tools underscores the advantages of BI in handling large datasets, providing advanced visualization, improving automation, enabling scalability, and fostering collaboration. As a result potential challenges, the strategic move to BI is an investment that yields quick returns.
For those intrigued by the prospect of exploring dynamic dashboards and accelerating their journey into the realm of BI, Qmantic stands as a valuable ally. To delve deeper into the possibilities of BI dashboards and experience the user-friendly interface of Qmantic, start a free trial at Qmantic. Unleash the power of data-driven decision-making and elevate your analytics journey with Qmantic.
Just visit freedemo.qmantic.com, where you can easily sign up for a free demo account.