In today’s data-driven world, businesses rely heavily on extracting meaningful insights from vast amounts of information. While Microsoft Excel has long been the go-to tool for data analysis and reporting, it has its limitations when it comes to handling complex business intelligence (BI) tasks. This article explores the downsides of relying solely on Excel for BI and highlights the advantages of using specialized BI tools. We will also introduce you to Qmantic, an all-in-one reporting suite that empowers organizations with comprehensive BI capabilities.

The Downsides of Excel for Business Intelligence
Excel is undeniably a versatile tool that can handle various tasks, including data organization, calculations, and basic visualizations. However, when it comes to advanced BI needs, Excel falls short in several areas.
• Limited Scalability
Excel has difficulty handling large volumes of data efficiently. As datasets grow, performance issues and file size limitations become apparent, leading to slow processing and potential data loss.
• Lack of Automation
Excel requires manual effort to import and transform data, making it time-consuming and prone to human errors. The absence of automated processes increases the risk of inconsistencies and reduces productivity.
Sharing Excel files across teams can lead to version control issues, especially when multiple users make simultaneous updates. This can result in conflicting data and jeopardize the accuracy and reliability of insights.
Advantages of Specialized BI Tools


To overcome the limitations of Excel, businesses are turning to specialized BI tools that offer advanced capabilities in the areas of Extract, Transform, Load (ETL), data warehousing, and visualizations. Here are the key advantages of using specialized BI tools:
• Efficient ETL Processes
Specialized BI tools provide streamlined ETL capabilities, allowing organizations to extract data from various sources, transform it into usable formats, and load it into a central data warehouse. These tools automate data integration, reducing manual effort and improving data accuracy.
• Robust Data Warehousing
BI tools offer dedicated data warehousing functionalities that optimize storage and retrieval of large datasets. They provide data modeling capabilities, data governance features, and security controls, ensuring the integrity and availability of valuable business data.
• Advanced Visualizations
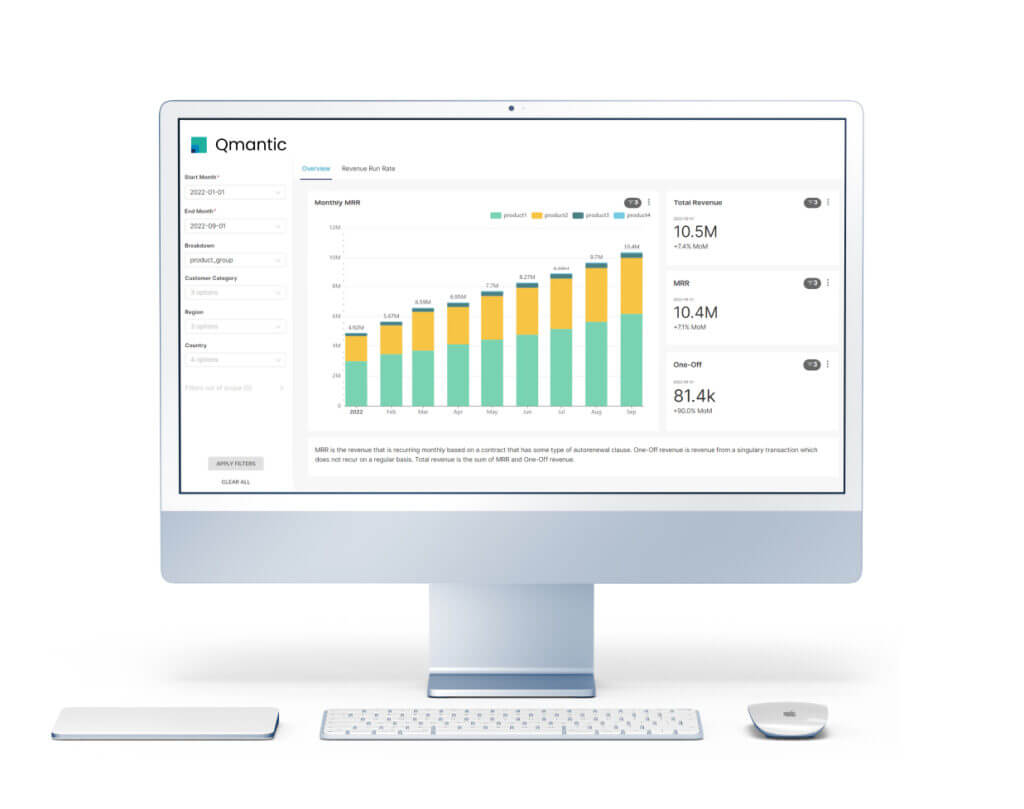
BI tools excel in creating interactive and visually appealing dashboards, reports, and charts. Moreover they provide intuitive drag-and-drop interfaces, enabling business users to explore data, spot trends, and derive insights with ease. Interactive visualizations empower decision-makers to make informed choices promptly.
Conclusion
While Excel remains a versatile tool for basic data analysis, relying solely on it for complex business intelligence tasks poses challenges. Specialized BI tools offer enhanced scalability, automation, and data integrity features, making them indispensable for organizations seeking to extract maximum value from their data.
If you want to unlock the full potential of your business data, try our Qmantic Data Platform – of comprehensive business intelligence services. Qmantic’s all-in-one reporting suite combines powerful ETL capabilities, robust data warehousing, and advanced visualizations, empowering your organization to make data-driven decisions with confidence. Check out our Reporting Suite to learn how Qmantic can transform your data into actionable insights.


