Insights as a Service
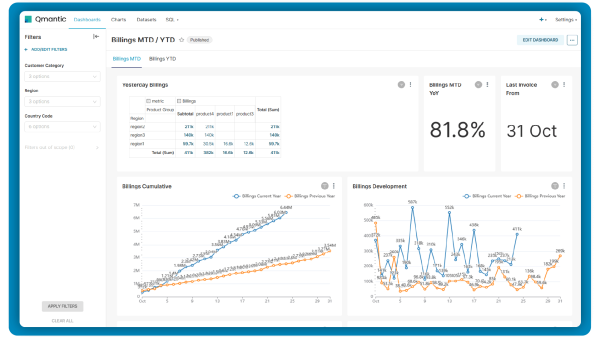
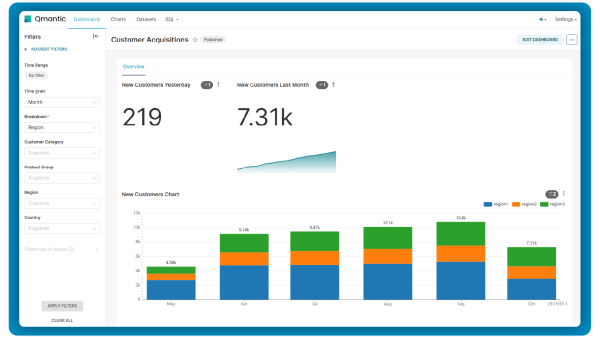
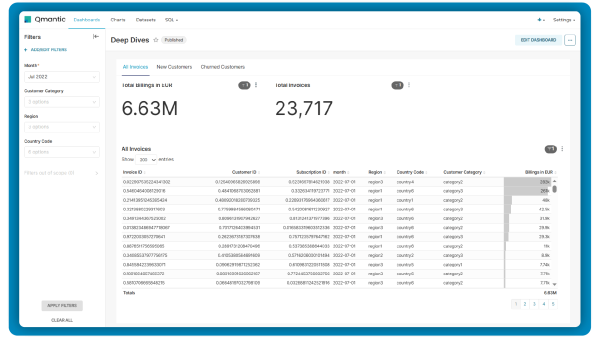
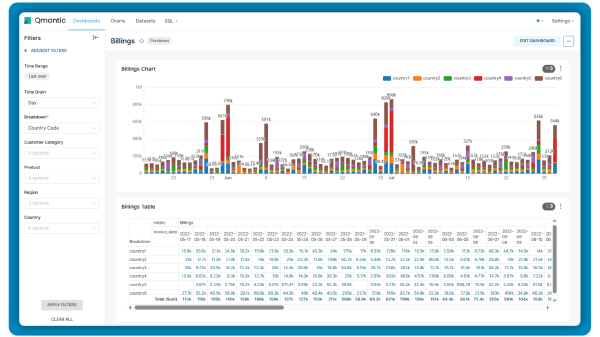
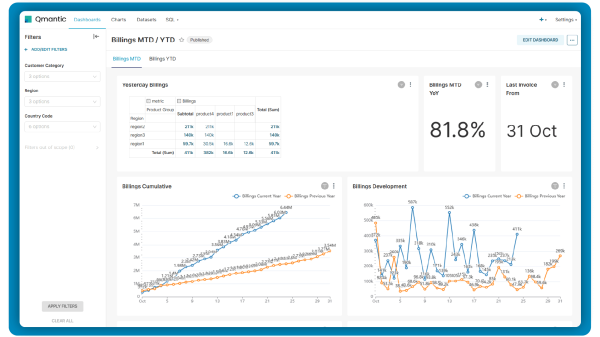
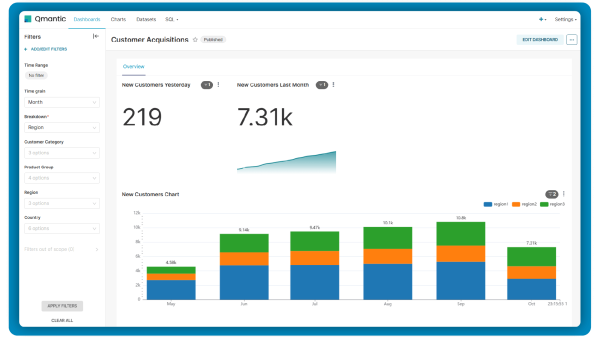
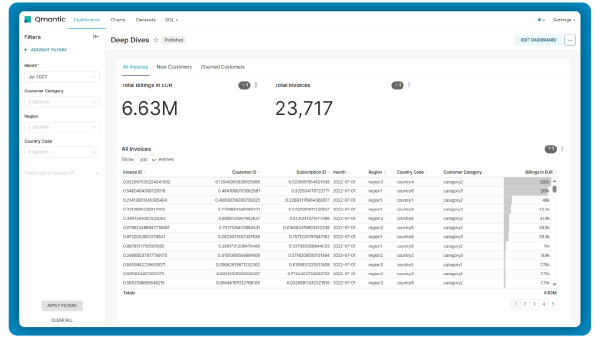
Introducing “Insights as a Service,” a comprehensive solution that provides you with ready-made dashboards and automated reporting capabilities, delivering valuable data-driven insights tailored to your company’s needs.
Furthermore, during the set-up phase, we will collect data from your operational systems and build a data warehouse for you. This data, linked together and aggregated, then forms the basis for visualizations, reports and dashboards.
Our extensive collection of templates covers a wide range of standard business cases, including Finance, Marketing, and Sales. These templates empower you to find answers to crucial questions such as:
- Revenue Performance: Is your revenue development aligning with your plans and objectives?
- Customer Acquisition: Where do your customers originate from, and what are the associated acquisition costs?
- Customer Cohorts: Are your customer cohorts improving over time, indicating positive trends?
- Net Retention Rate: What is your current net retention rate, and what factors contribute to it?
- Marketing Investment: How much is your organization investing in marketing, and what is the return on this investment?
- Sales Pipeline: Gain visibility into the status of your sales pipeline and forecast the closure of deals.
Experience the efficiency and power of automated reporting for your business today.
Let's get started!
How do we start working together ?

Initial Call
Once you reach out to us, we will schedule a call to understand your needs and requirements.

You get a proposal
Based on your input, we will send you a detailed proposal, including the pricing.

Implementation
You and your team will be able to test everything before you make a decision.
