"After testing many BI tools, I suggest Qmantic for fast-moving subscription businesses. It automates our reports and provides us daily growth insights. It is very valuable that our investor reporting has become fully automated."

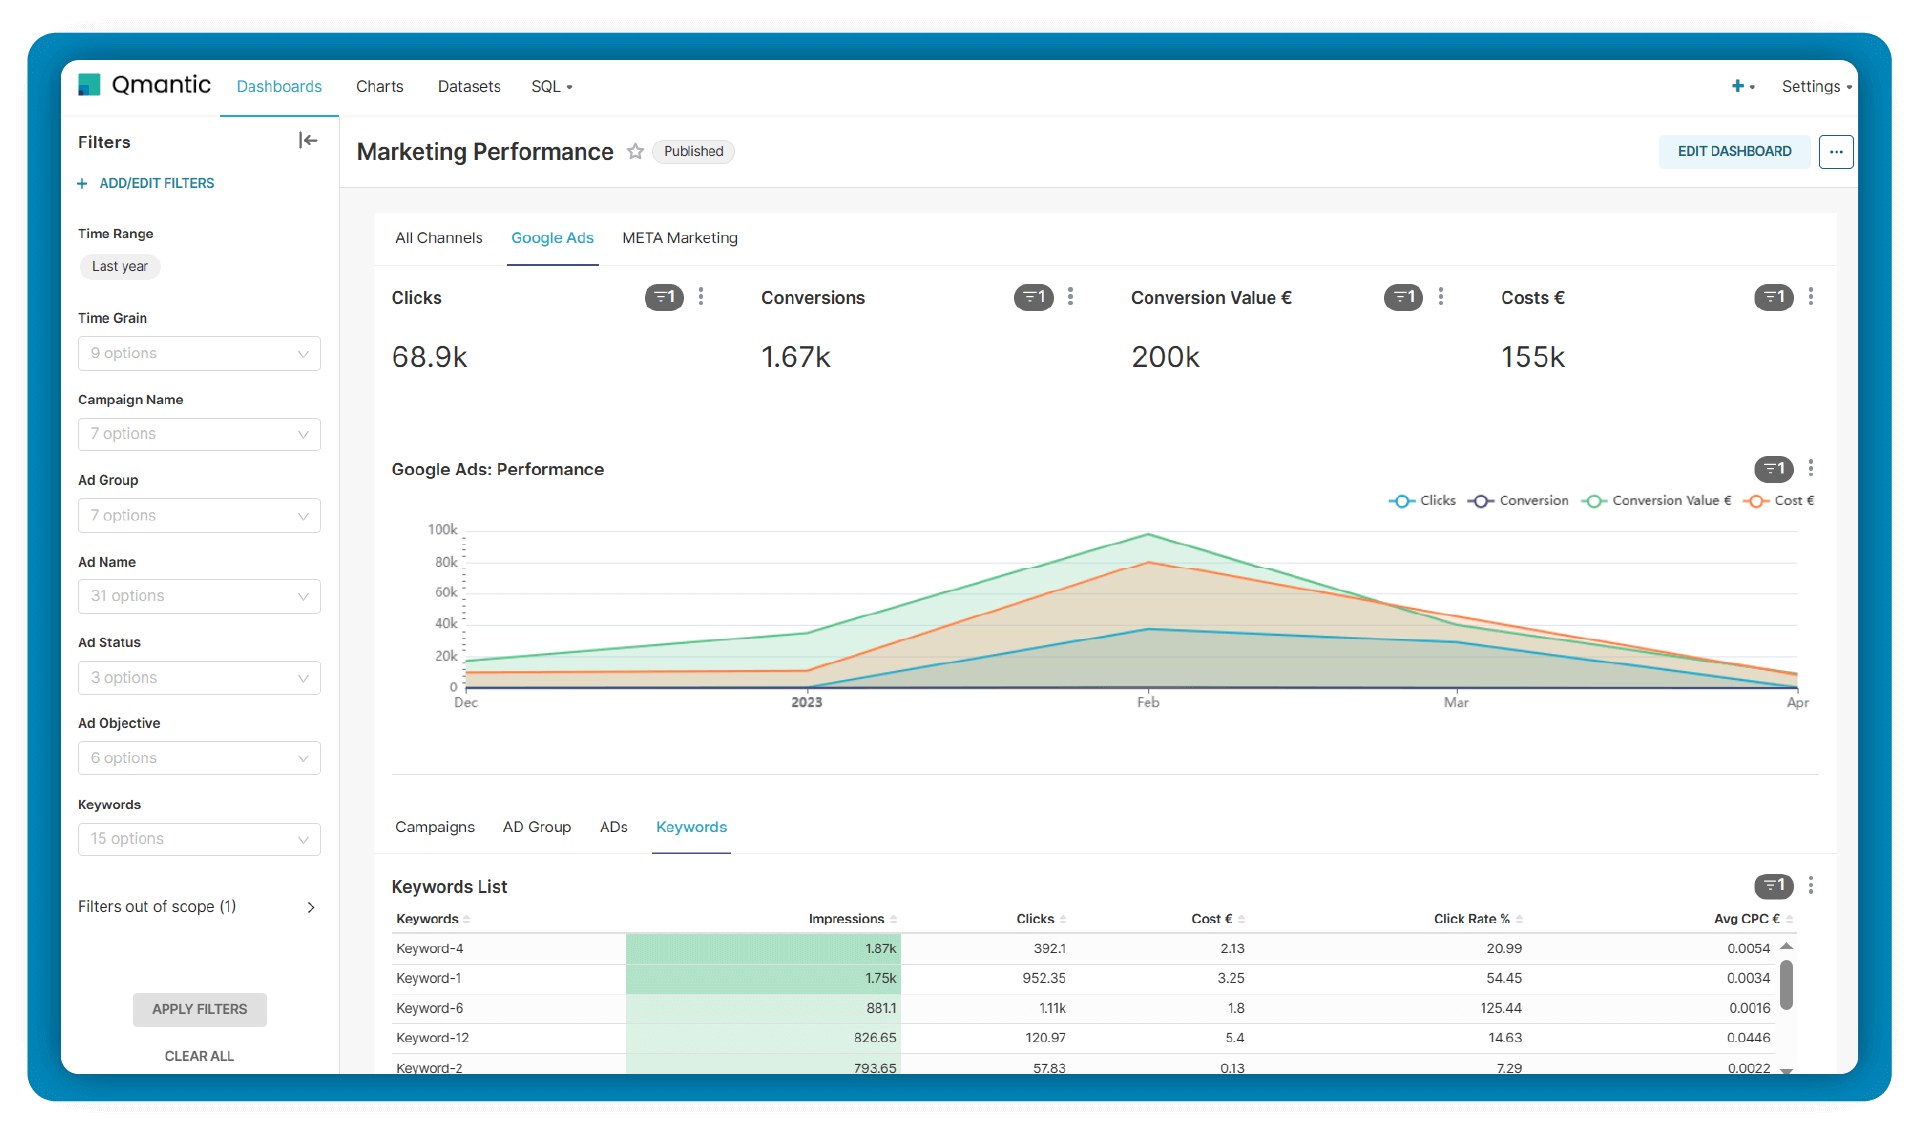
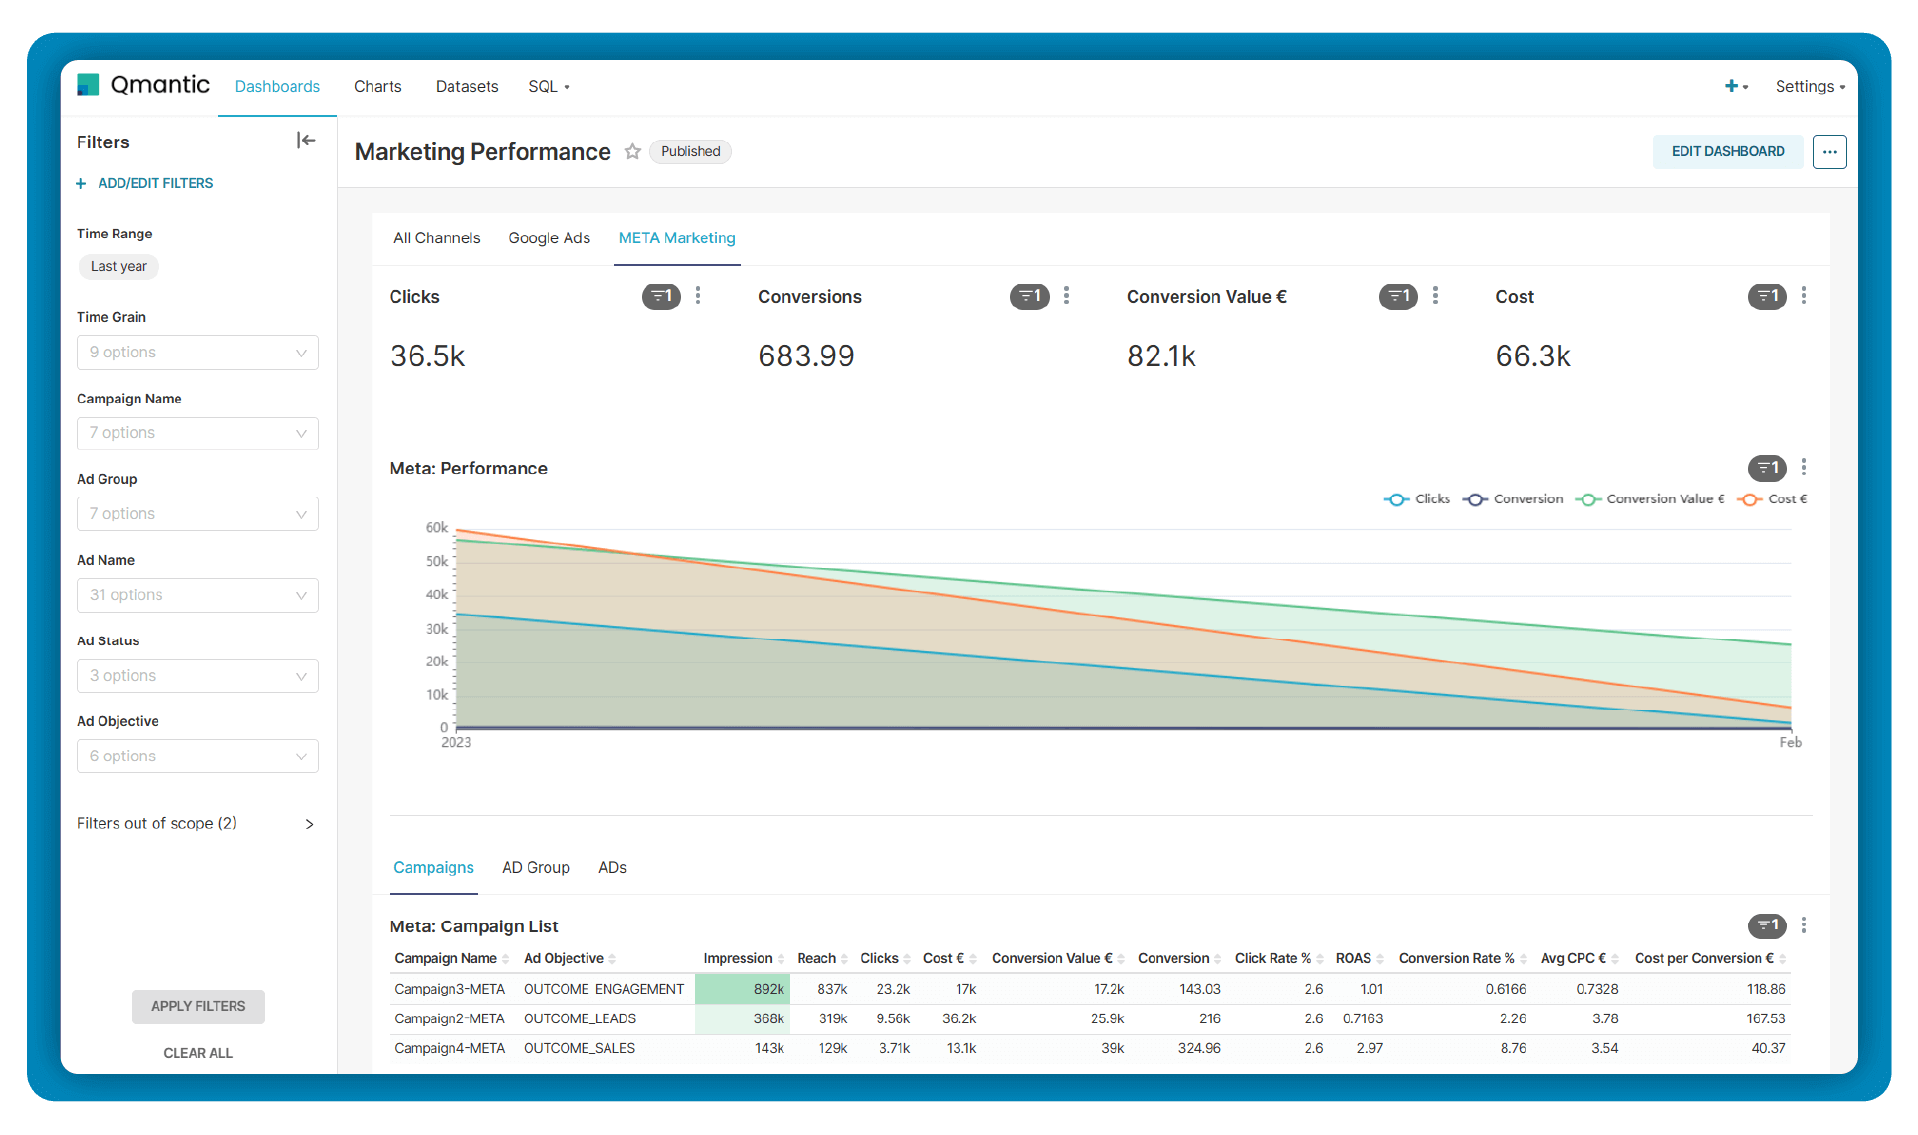
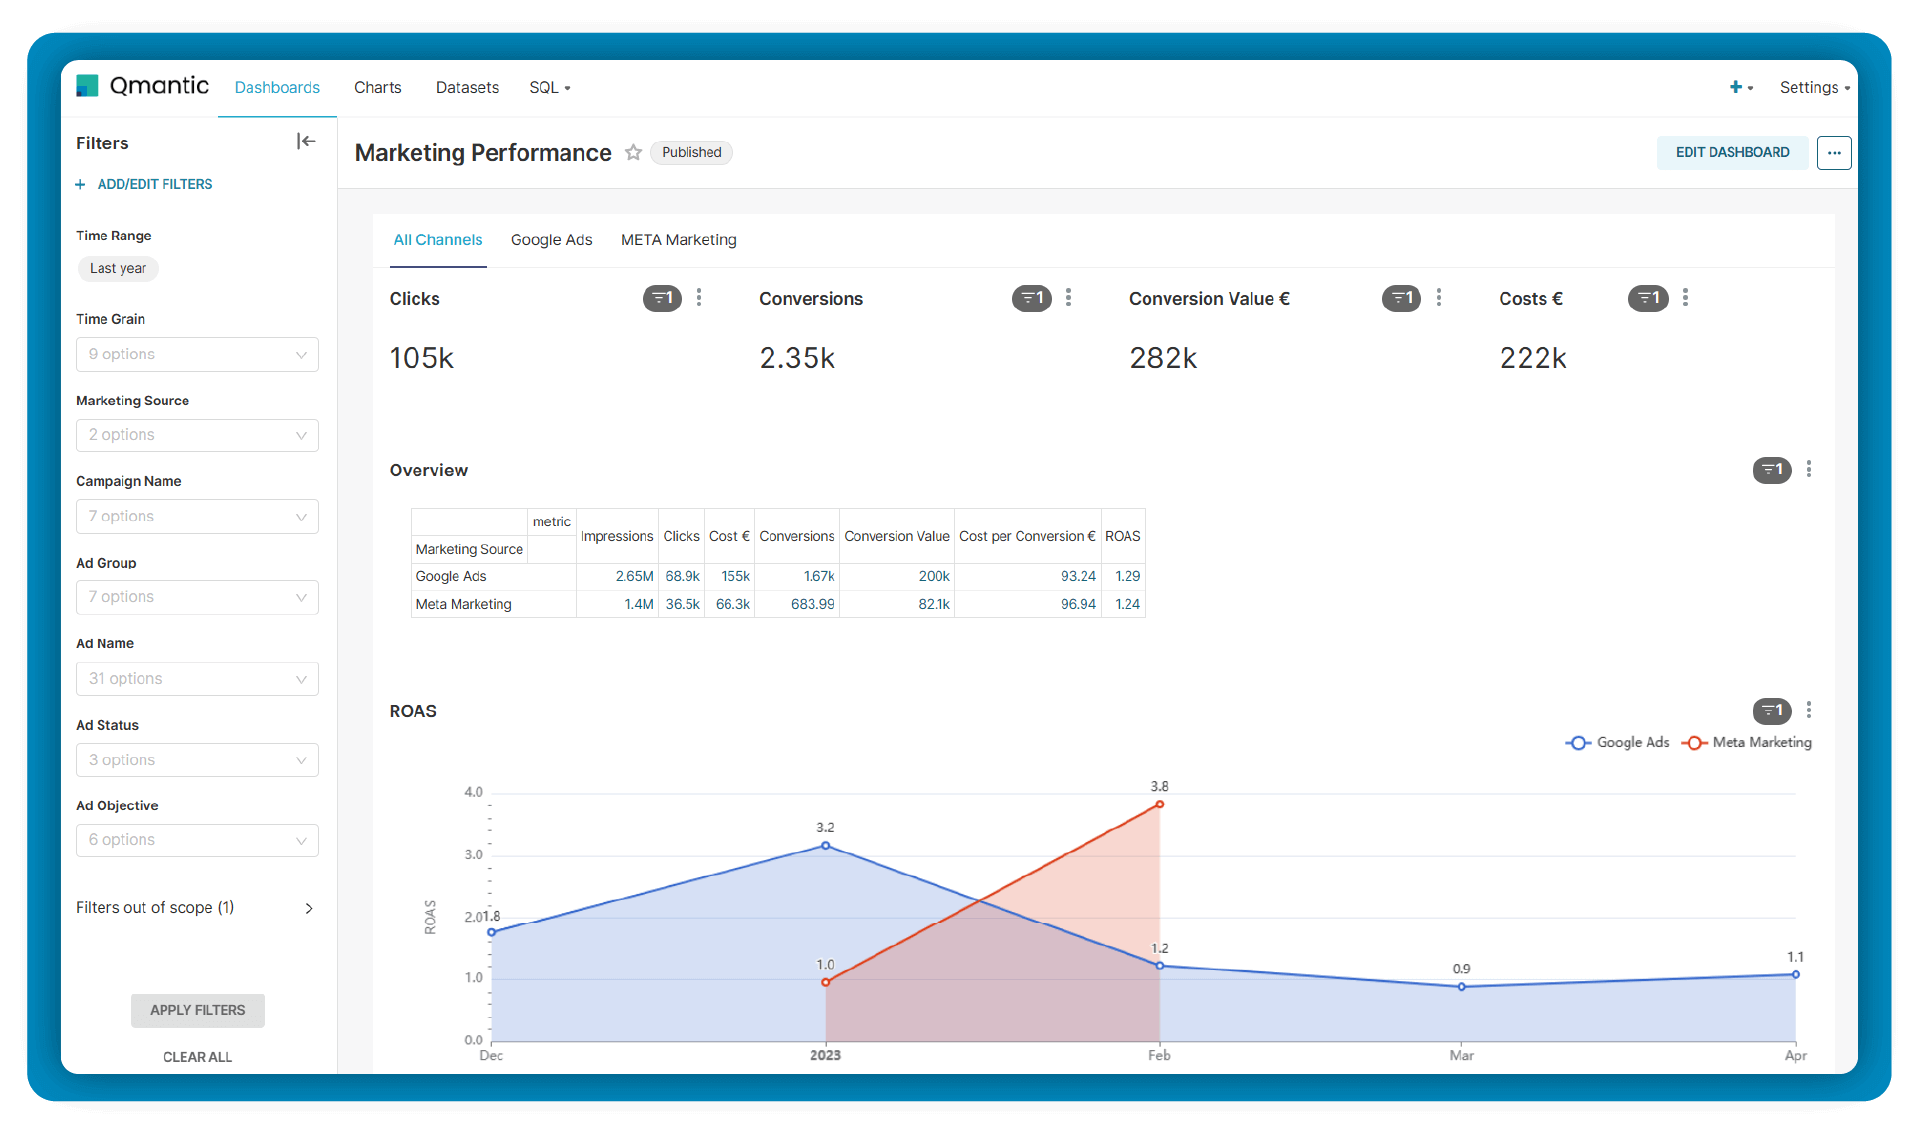
"Qmantic ensured a seamless setup, providing us with an ideal tool for efficient daily business management, particularly for marketing controlling."

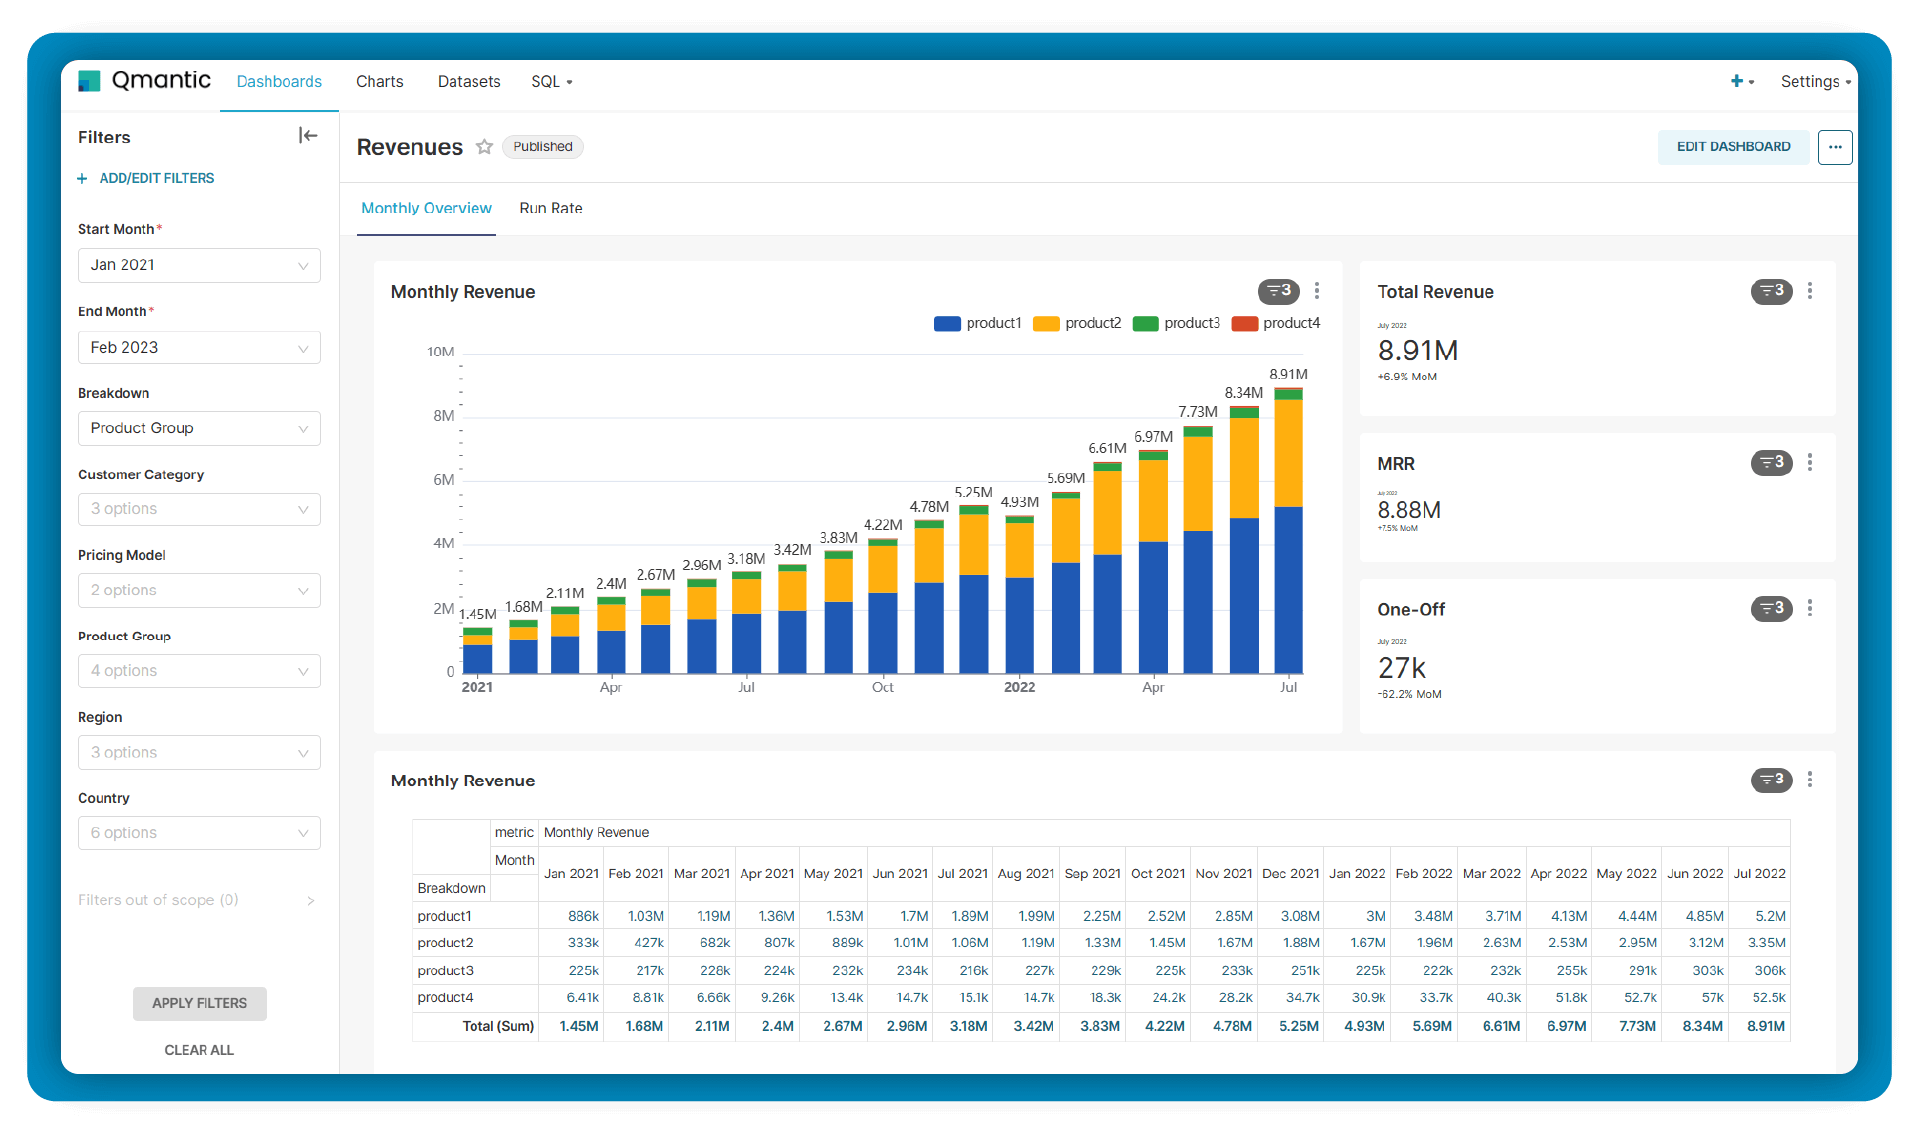
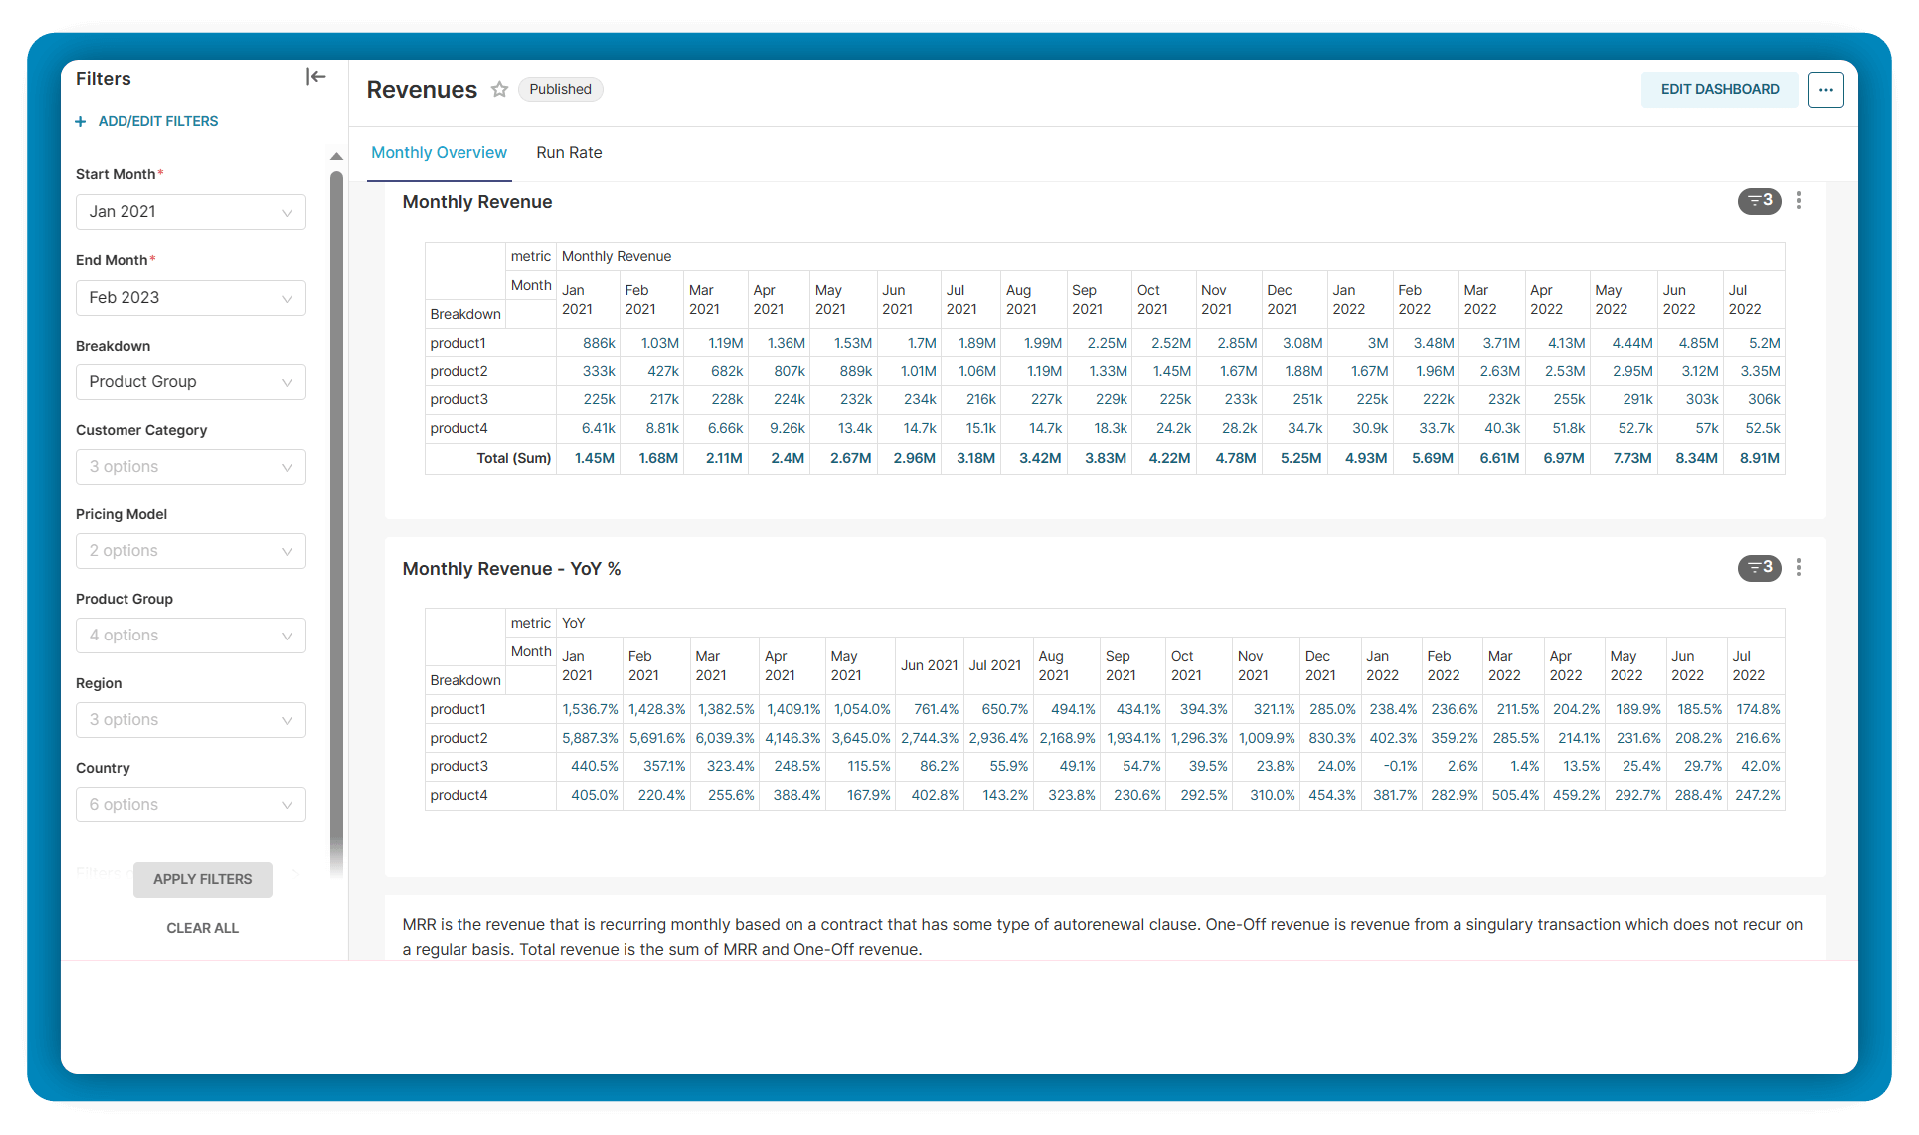
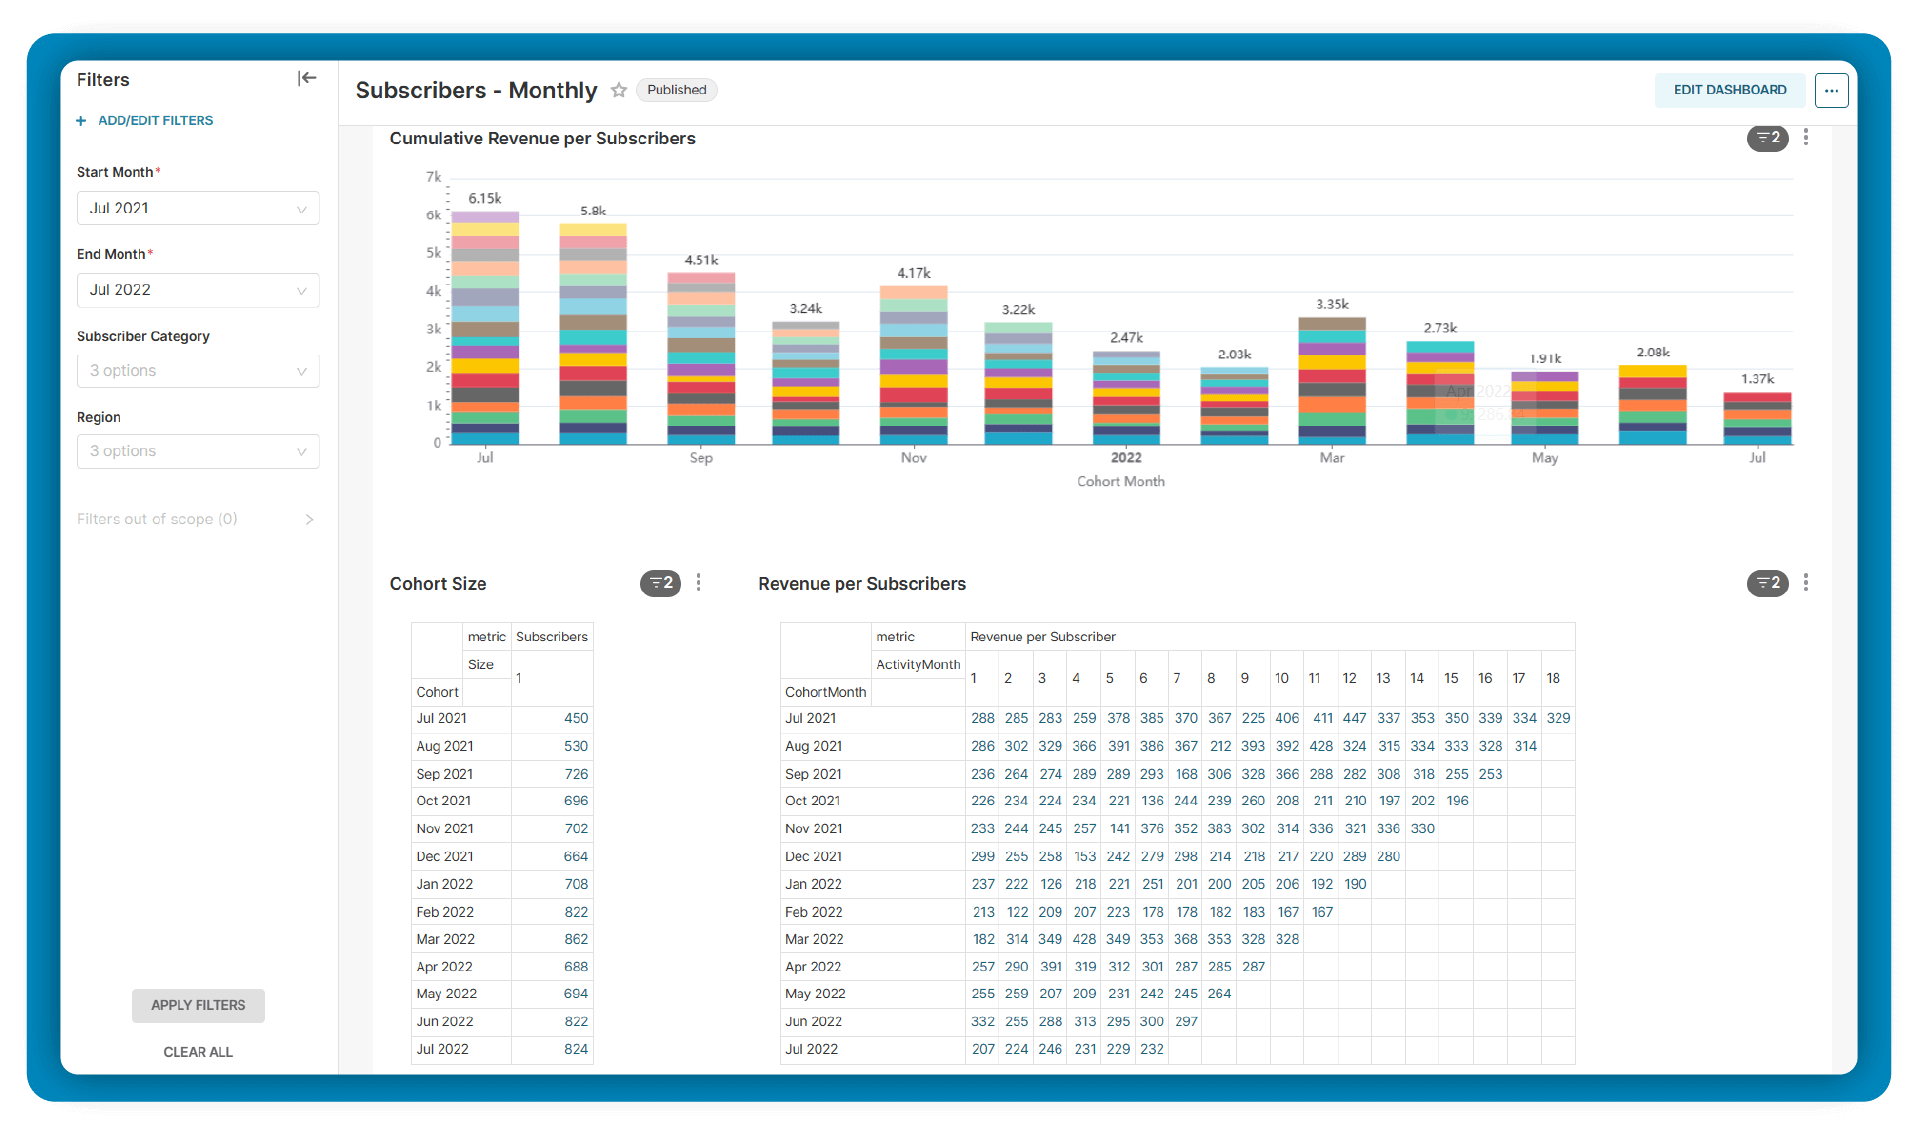
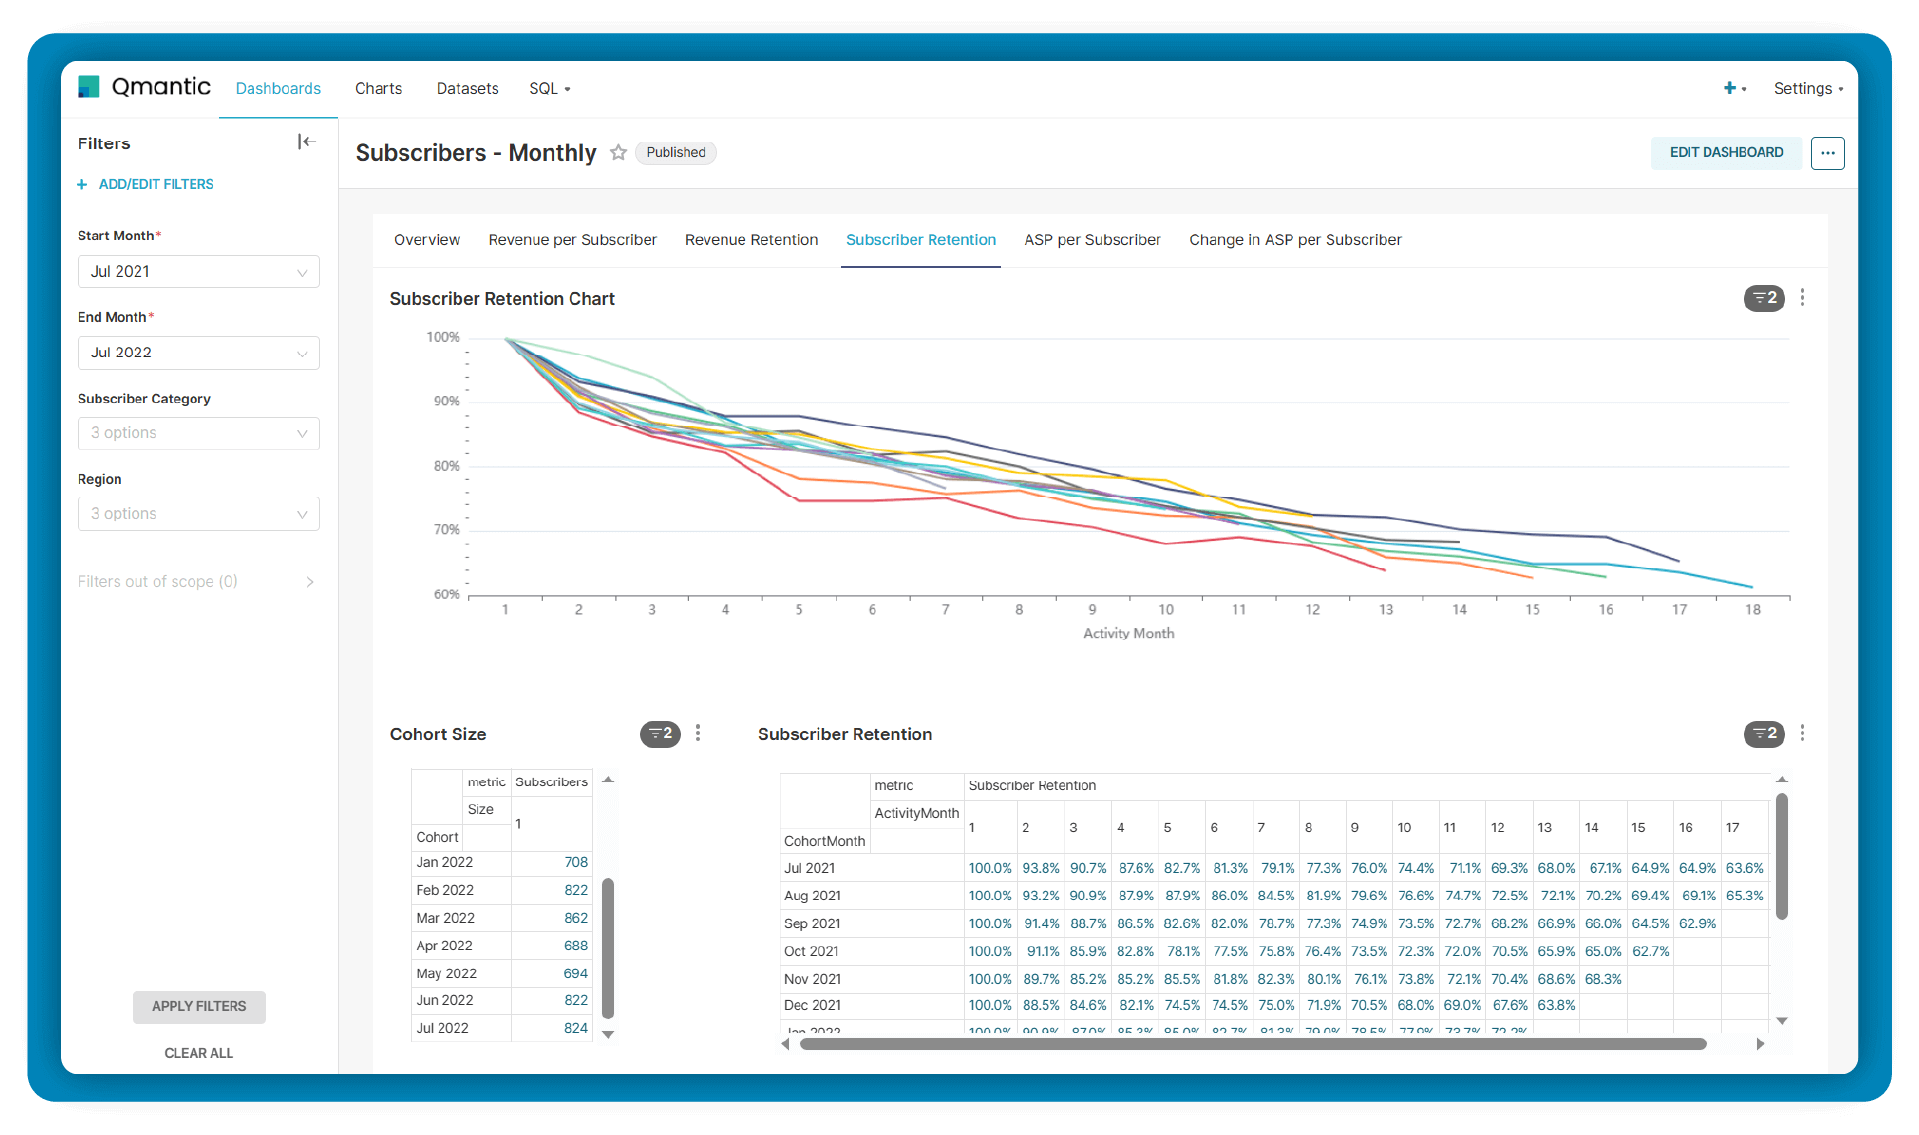
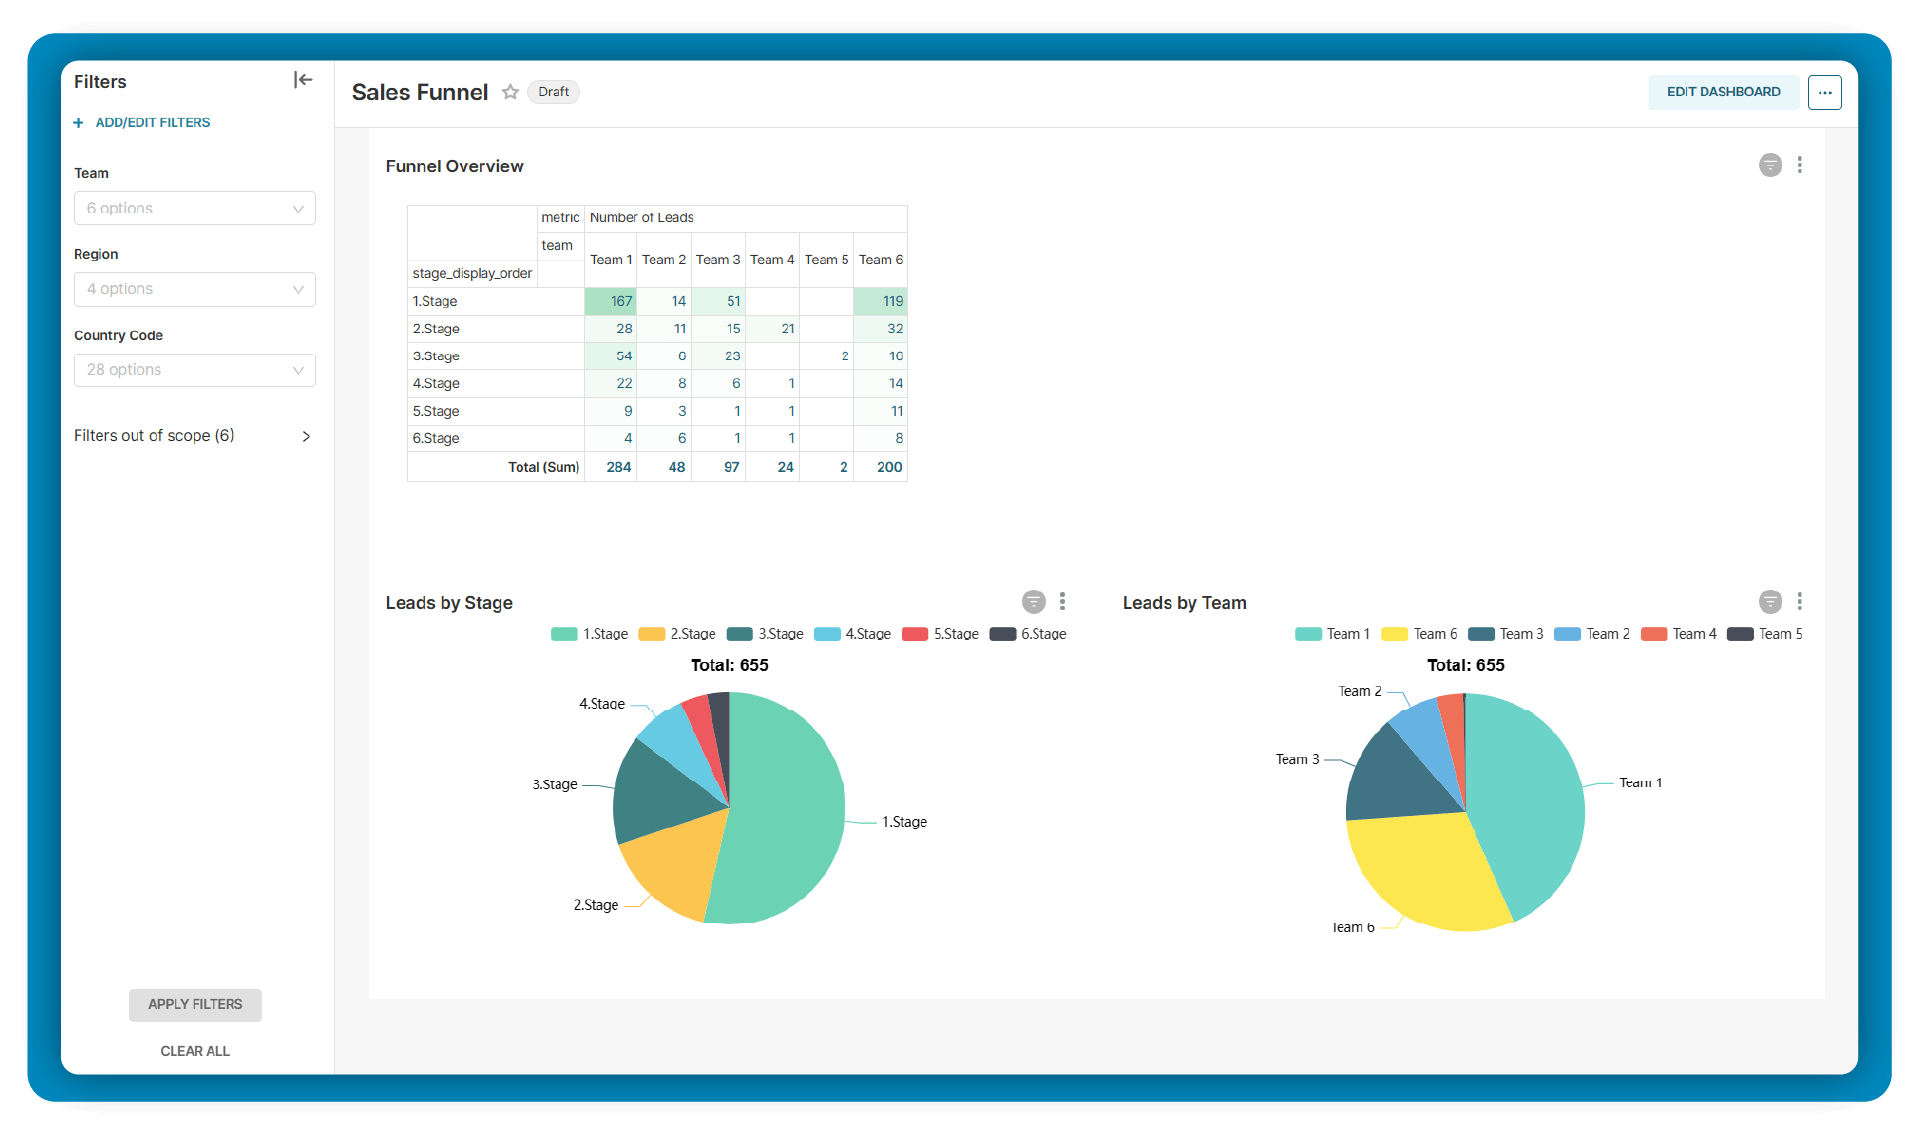
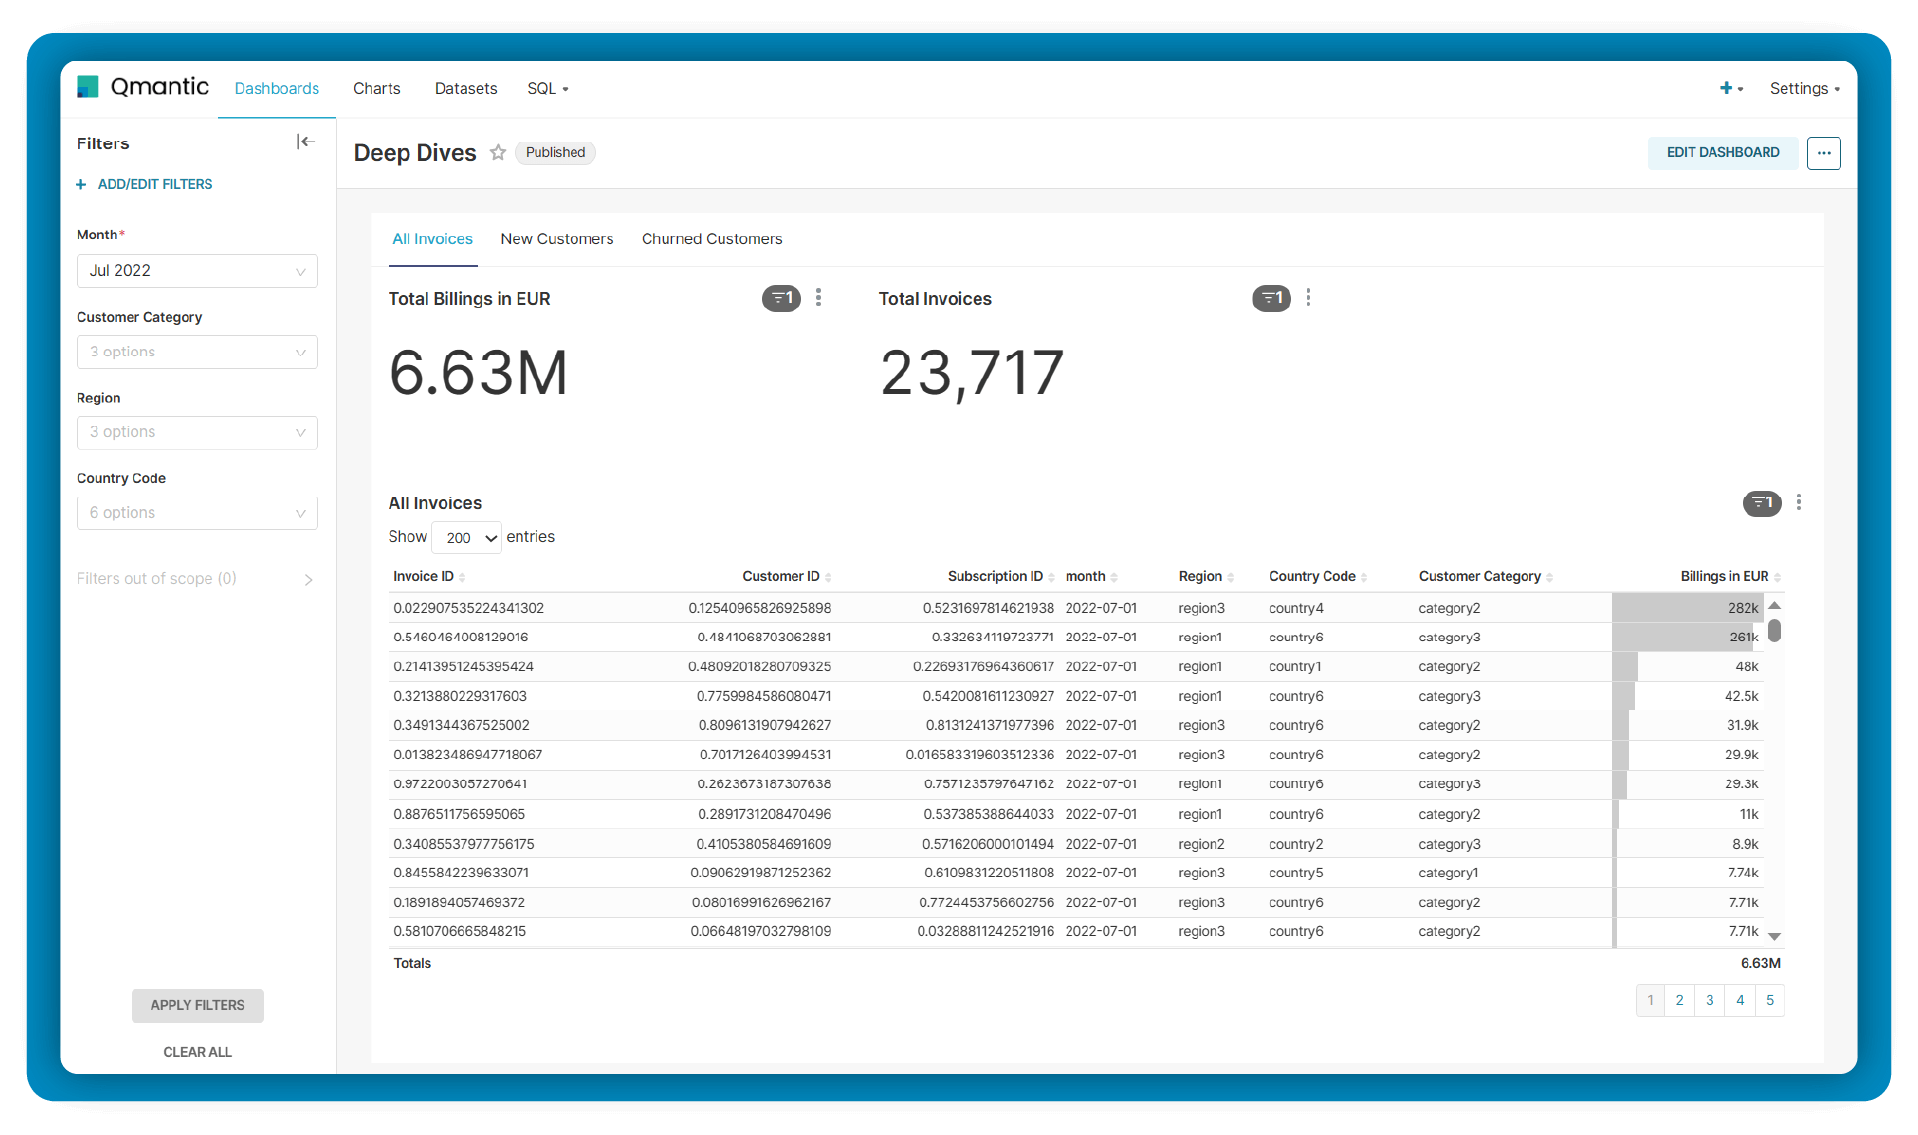
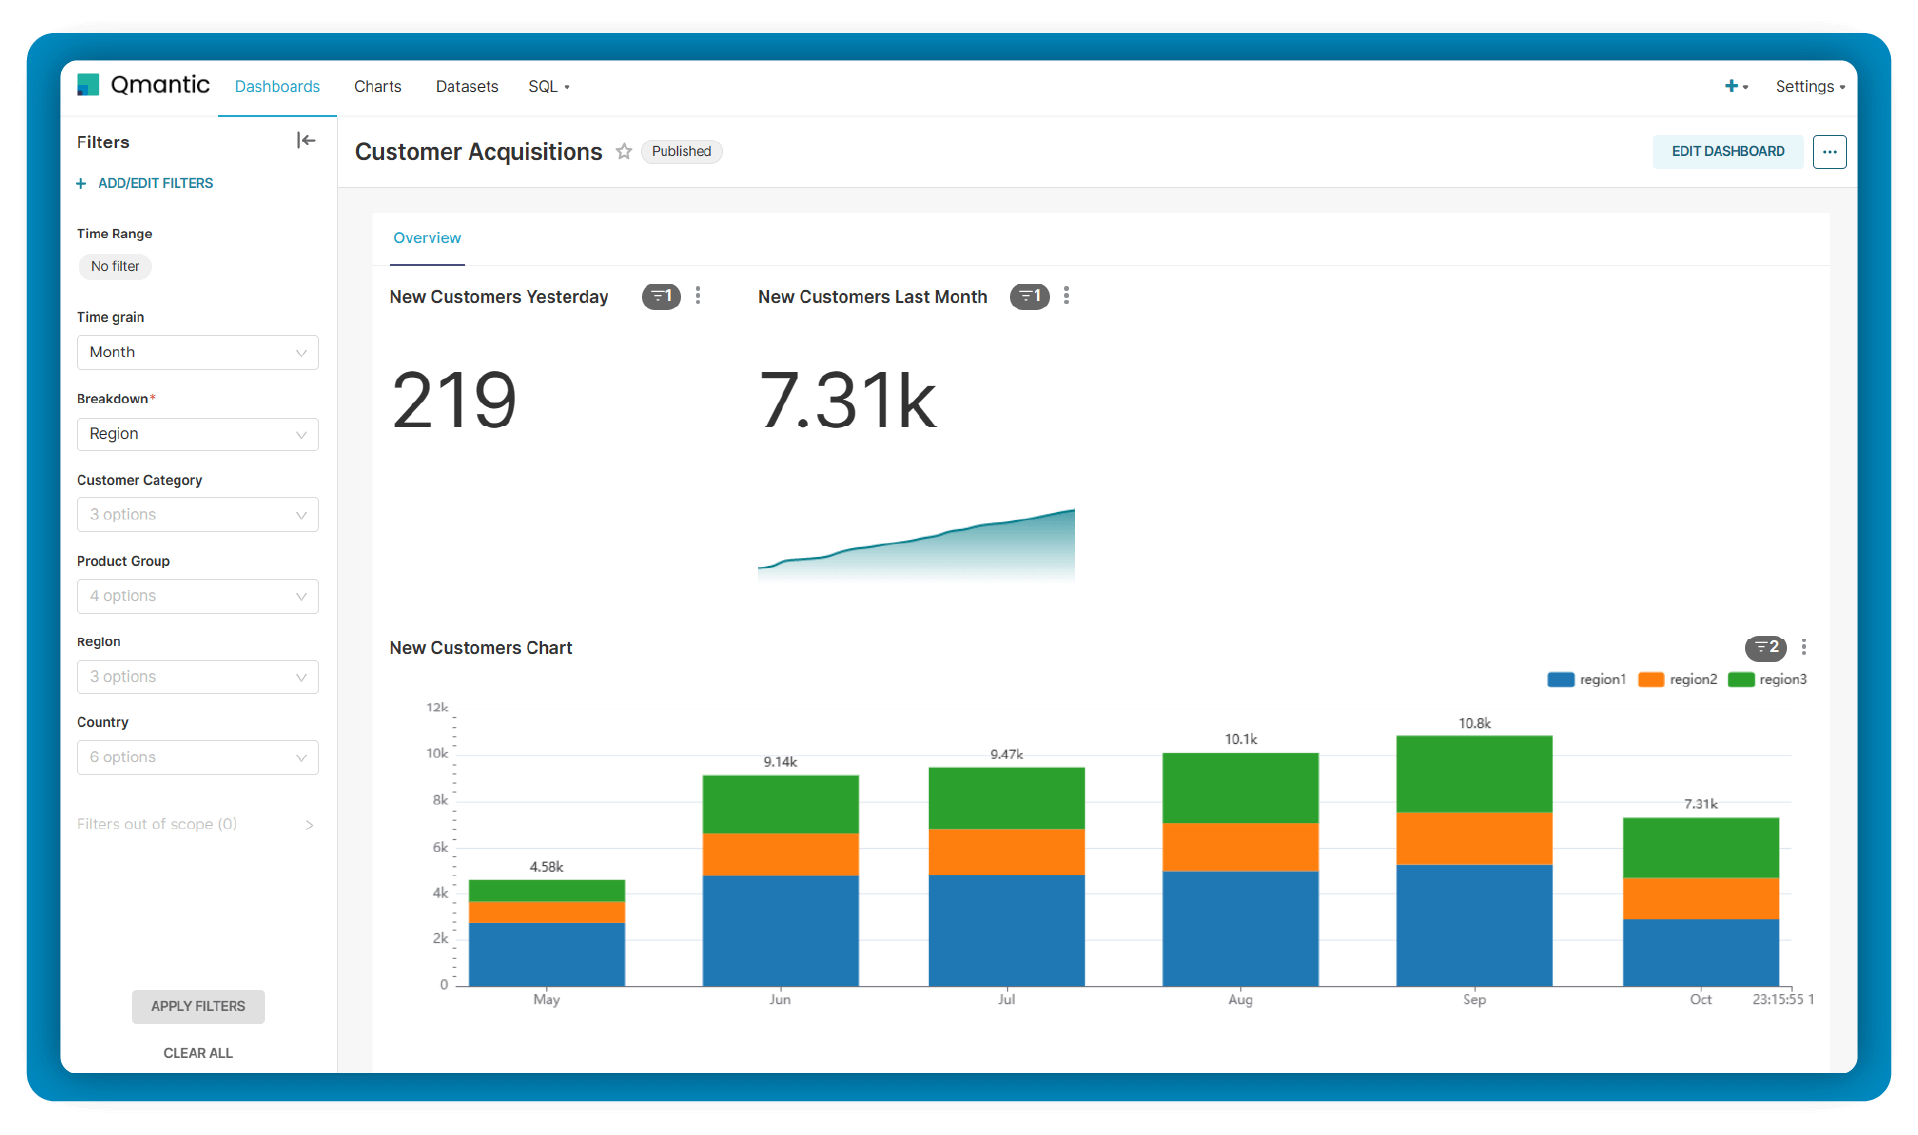
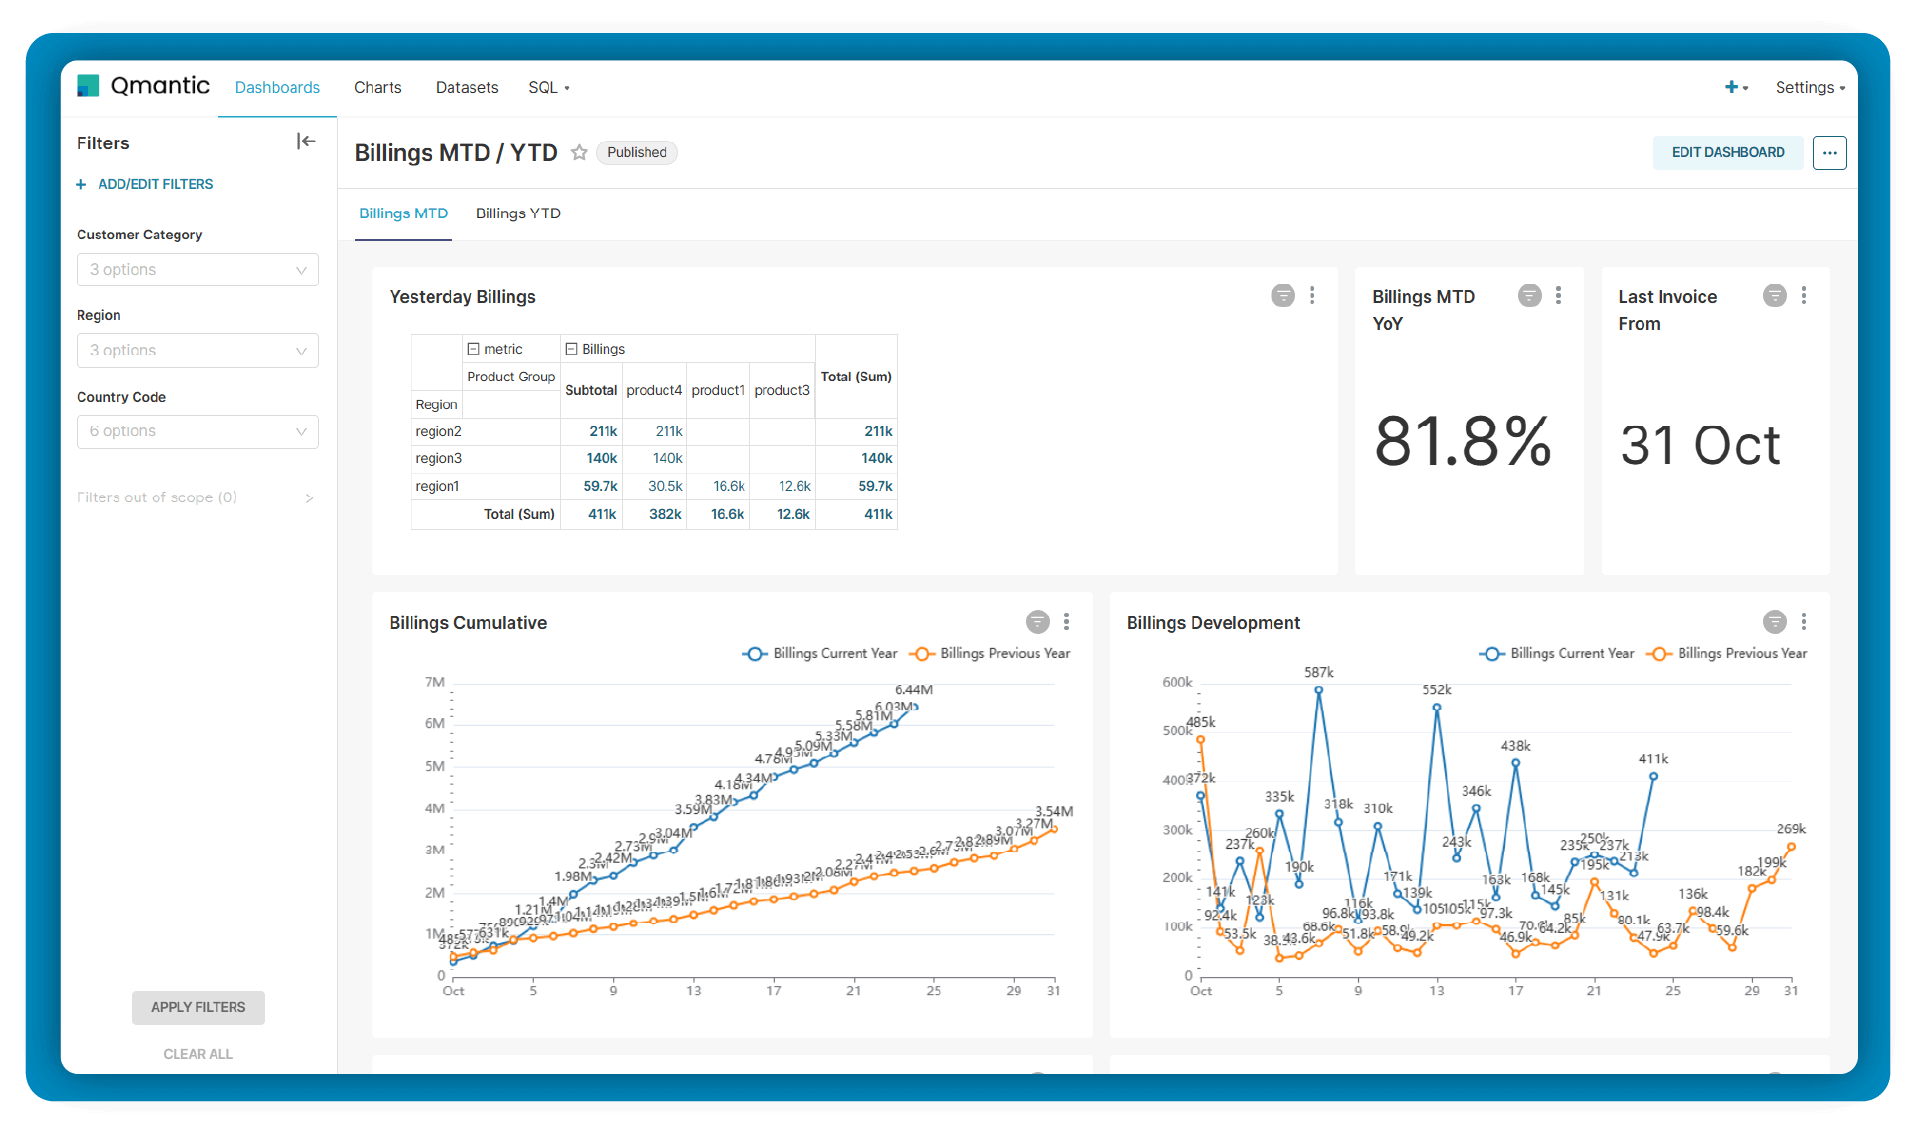
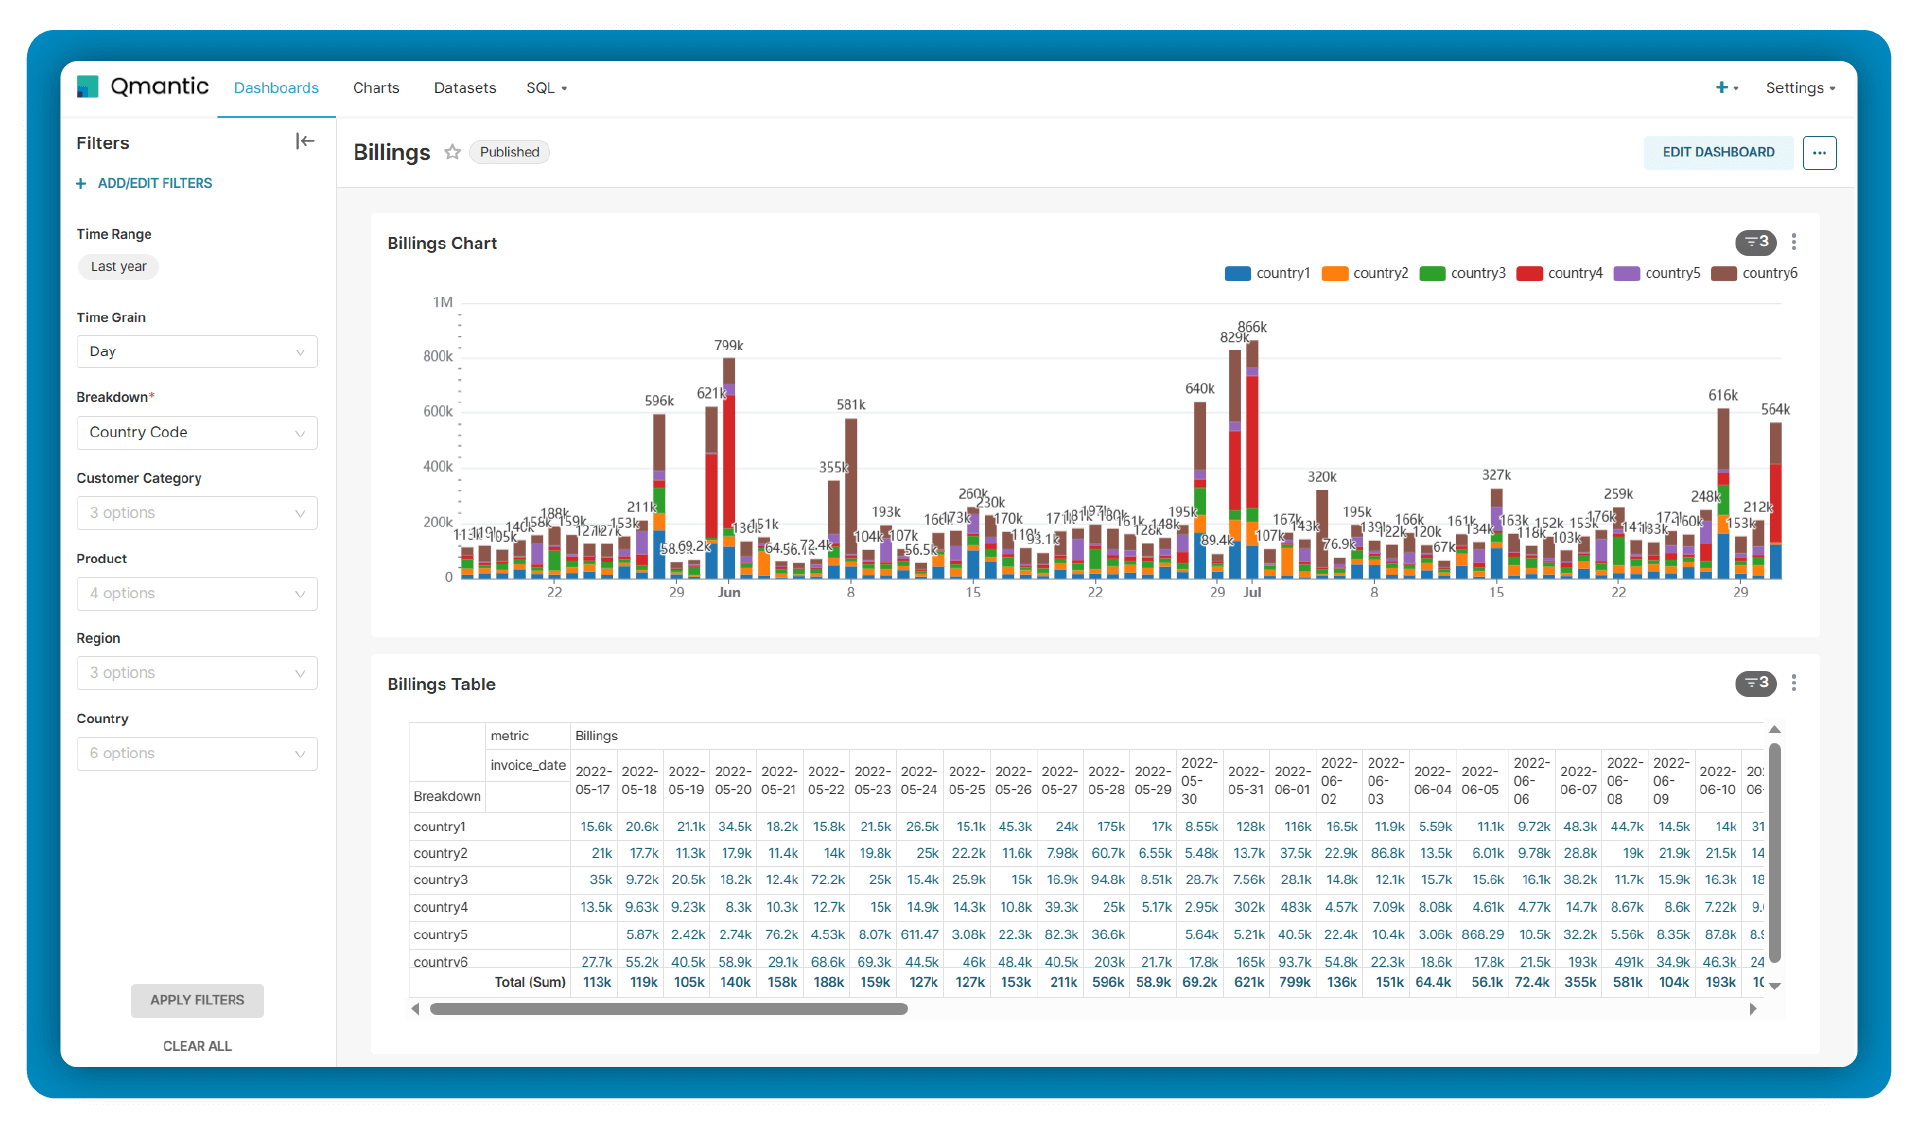
Qmantic Dashboards have been a game-changer for us, reducing manual effort in reporting and providing a much more granular visibility on billing, MRR, customers, and products. The impact on our efficiency and insights has been truly remarkable.


Initial Call
Once you reach out to us, we schedule a call to understand your needs and unique requirements.

You get a proposal
Based on your situation, we send you a detailed proposal.

Implementation
Upon signing we start implementing. After implementation you can test the solution and we will ensure agreed outcomes.