Reporting Suite
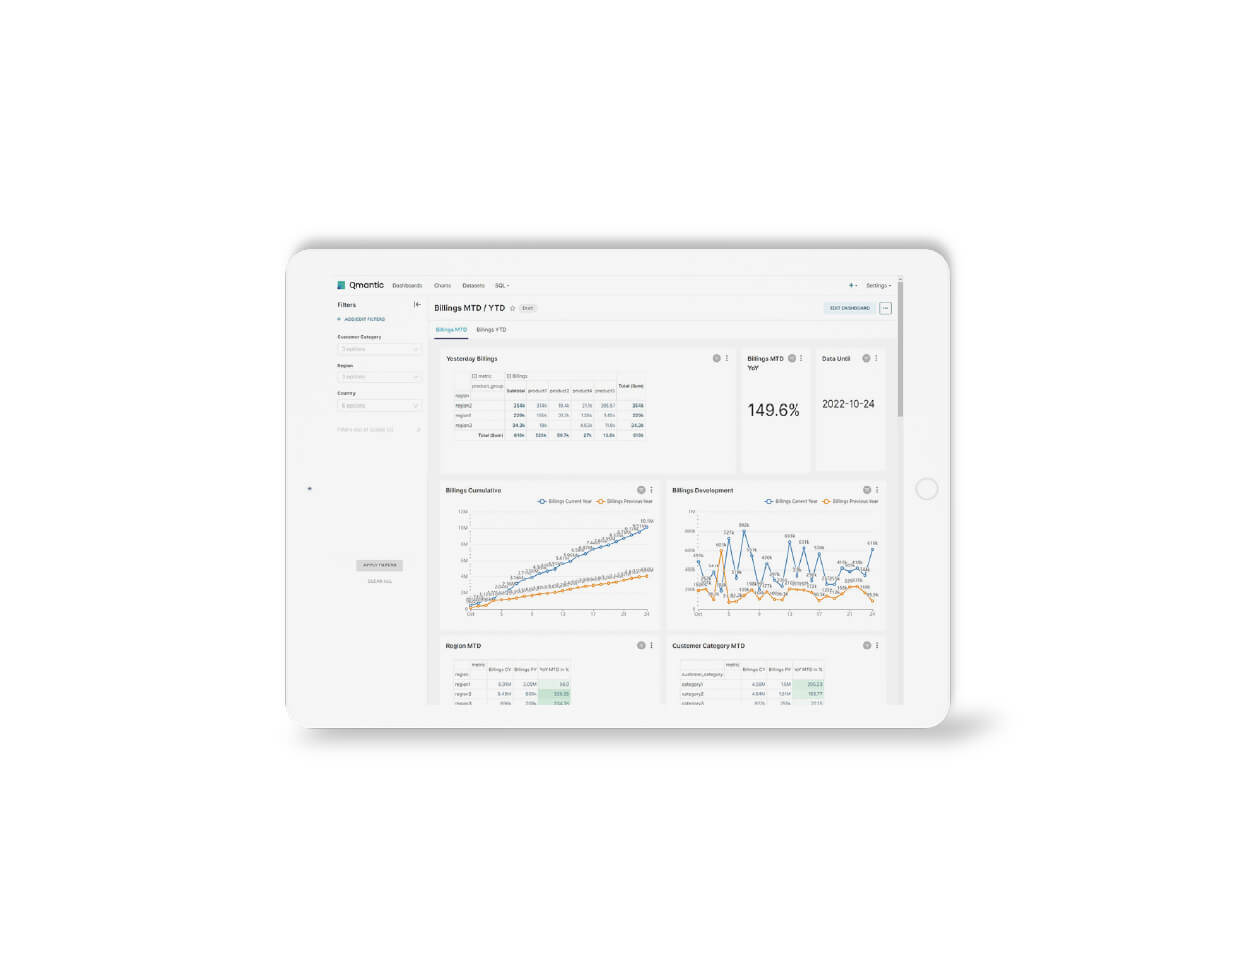
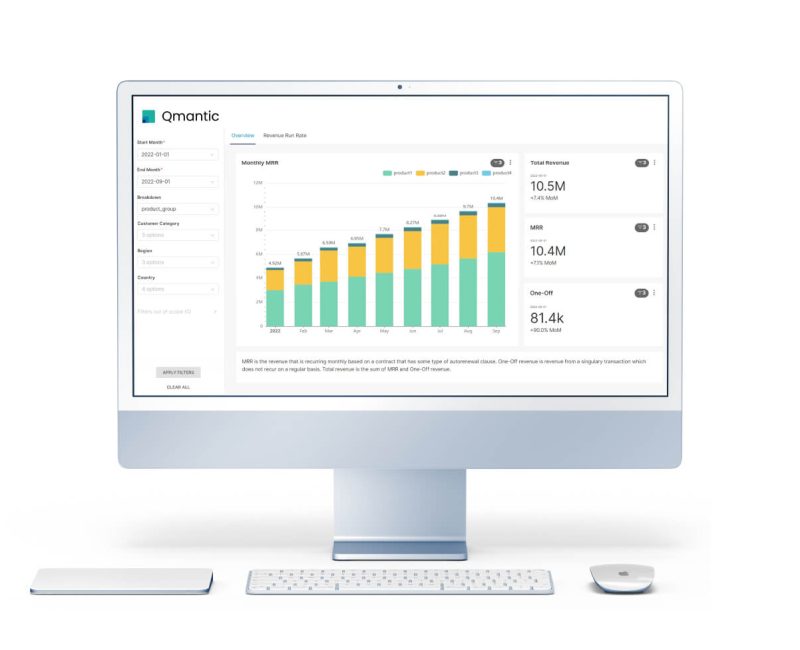
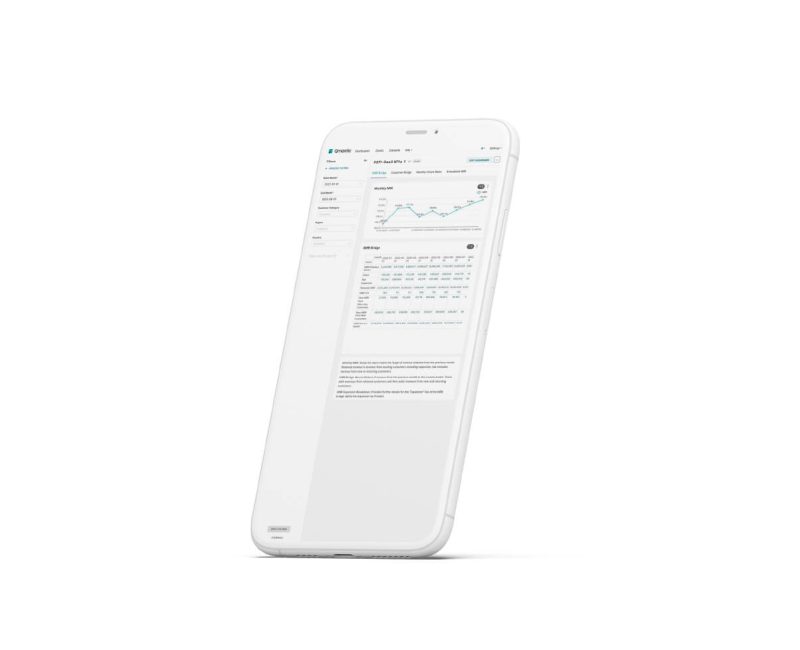
No matter if you use our Data Availability Service or have your own data warehouse already built, you will need a data visualization tool to make the data digestible and accessible. Our Reporting Suite not only creates appealing graphs and tables but also enables you to zoom into segments and modify the data breakdown.
By leveraging the Qmantic Reporting Suite, you can effortlessly create personalized dashboards using your connected raw data, ensuring easy accessibility for all members of your organization.
Contact us for a Free Trial!
I agree to receive email communications from BI2Value GmbH. See our Privacy Policy for more details.
Features for creators
- Create reports and dashboards with a drag-and-drop editor
- Choose from dozens of data visualization from simple bar charts and line charts to advanced funnel and flowcharts
- Publish your dashboards and share it with anyone in your organization
- Transform your data using SQL and Jinja templates
- Assign roll-based access credentials – Set up regular e-mail send outs for dashboards, etc.
Features for the organization
Single Sign-On: Add Qmantic to your SSO tool, like OneLogin, OKTA, Keycloak etc. to give your team access without creating more passwords
Unlimited Users: Everyone in your organization gets access and can make use of the insights generated
- Roll-based Access Control: Decide who can access what content based on roles (e.g. Finance role, Marketing role, Sales role, etc)
Reach out today and request a free trial!
Let's get started!
Qmantic comes with a lot of useful features:
Currency Conversion
No matter what currency you use for invoicing, we will convert everything into your reporting currency.
Merge Data from different Sources
Switching ERPs is sometimes necessary. We will load and merge data from both systems.
Choose Subscription Interval
Depending on whether you sell monthly or yearly subscriptions, pick MRR or ARR as your primary reporting metric.
Pick the Colors
Send us your corporate design and color scheme and we will apply it to all charts and graphics.
Schedule E-Mails
Pick the time and interval and have any dashboard sent to your inbox.
SSO integration
Integrate Qmantic with SSO providers like Okta or OneLogin.
Define country grouping
APAC, MENA, ROW - every business has a different country grouping. Define yours with as many levels as needed.
Whatever you need
Let us know what your needs or painpoints are and we will find a solution. Please reach out!
Let's get started!
How do we start working together ?

Initial Call
Once you reach out to us, we will schedule a call to understand your needs and requirements.

You get a proposal
Based on your input, we will send you a detailed proposal, including the pricing.

Implementation
You and your team will be able to test everything before you make a decision.
