Welcome to the essential guide on Software as a Service (SaaS) metrics for 2024. As the digital realm continuously evolves, understanding key SaaS metrics remains crucial for businesses aiming for success. In this guide, we’ll look into the significant metrics for 2024, underlining their importance, methods of analysis, and technological advancements that can enhance your understanding. Our insights go beyond theory, offering a practical examples of these metrics based on concrete scenarios.
What are the top SaaS metrics in 2024?
SaaS (Software as a Service) metrics are specific key performance indicators (KPIs) that SaaS businesses use to measure their performance, growth, and overall health. These metrics provide valuable insights into various aspects of a SaaS company’s operations and customer relationships. In 2024, SaaS metrics have become even more sophisticated, reflecting the changing needs and demands of the market. SaaS Key Performance Indicators (KPIs) are vital metrics and data points that SaaS businesses rely on to evaluate their performance and overall health. These metrics are indispensable for assessing various aspects of a SaaS company’s operations, growth, and overall success.
The top SaaS metrics can vary based on the specific goals and focus of a company. However, some key metrics are universally important for SaaS businesses to monitor. Here are the top SaaS metrics for 2024:
- ARR (Annual Recurring Revenue)
- MRR (Monthly Recurring Revenue)
- NPS (Net Promoter Score)
- NRR (Net Revenue Retention)
- QLVR (Qualified Lead Velocity Rate)
- CAC (Customer Acquisition Cost)
- ROAS (Return on Advertising Spend)
- CLV (Customer Lifetime Value)
- NPS (Net Promoter Score)
- Churn Rate
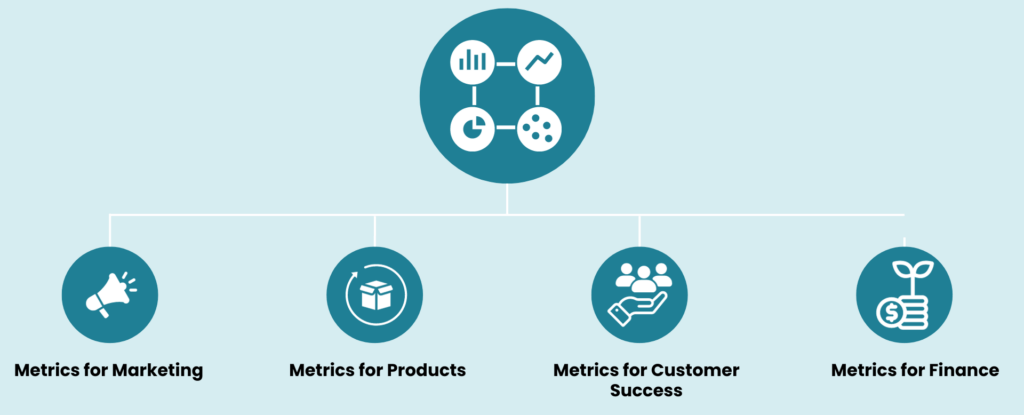
4 SaaS KPI Categories
When evaluating a SaaS company’s performance, it’s crucial to cover four main areas: sales & marketing, revenue operations, product usage, and customer experience. Even if you choose to monitor a select few KPIs, these key areas serve as benchmarks for assessing your overall business performance.
Marketing
- NPS (Net Promoter Score): Measures customer loyalty by assessing the likelihood of customers recommending a product or service.
Products
- NRR (Net Revenue Retention): Illustrates revenue growth from existing customers, encompassing expansions, churn, and contractions.
- QLVR (Qualified Lead Velocity Rate): Measures the speed at which high-quality leads enter the sales funnel, emphasizing the importance of relevance over quantity.
Customer Success
- CAC (Customer Acquisition Cost): Quantifies the average expenditure to acquire a new customer, representing the investment made in building relationships with potential customers.
- CLV (Customer Lifetime Value): Represents the total revenue a business can anticipate from a customer over the entire duration of their relationship, incorporating customer loyalty, repeat purchases, referrals, and overall engagement.
Finance
- MRR (Monthly Recurring Revenue): Aggregate monthly revenue from subscription-based customers, indicating monthly revenue stability.
- ARR (Annual Recurring Revenue): Total revenue anticipated from subscription-based customers over a year, providing a longer-term view of revenue stability for strategic planning and financial forecasting.
- Churn Rate: Measures the rate at which customers stop subscribing to a service, indicating customer attrition over a specific period.
- ROAS (Return on Advertising Spend): Assesses the efficiency of advertising efforts in generating not only immediate sales but also fostering customer connections and brand loyalty.
These four categories form the foundation for evaluating various aspects of your SaaS business. Meanwhile, through consistent monitoring and in-depth analysis of these KPIs, you can gain valuable insights to guide decision-making, enhance operational efficiency, and foster growth and customer satisfaction in an intensely competitive market.
With a solid understanding of these crucial SaaS KPIs and their categories, you are well-equipped to assess your SaaS company’s performance effectively in the thriving landscape of 2024.
ARR (Annual Recurring Revenue)
What is Annual Recurring Revenue?
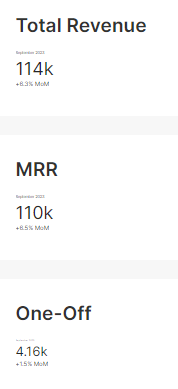
Annual Recurring Revenue (ARR) represents the projected annual income derived by a SaaS company from customers who have subscribed to their services or committed to multi-year contracts. ARR is valuable for businesses as it offers a longer-term view of revenue stability and is instrumental in strategic planning and financial forecasting.

Why Do We Measure It?
Measuring metrics like Annual Recurring Revenue (ARR) in the context of SaaS businesses is essential for financial planning, business health assessment, strategic goal setting, investor attraction, business valuation, customer relationship management, and market competitiveness. In 2024, ARR serve as the heartbeat of SaaS businesses. A significant portion of recurring revenue makes it easier for companies to secure funding from venture capital and equity firms thanks to the stability it represents, leading to more favorable terms for investments.
MRR (Monthly Recurring Revenue)
What is Monthly Recurring Revenue?
MRR, or Monthly Recurring Revenue, signifies the aggregate monthly revenue generated from subscription-based customers. It is a crucial metric for businesses operating on subscription models, offering a clear picture of their monthly revenue stability.
Why Do We Measure It?
Measuring Monthly Recurring Revenue (MRR) is essential for SaaS businesses as it provides real-time insights into their financial stability and customer trends. By tracking MRR, companies can make immediate decisions on resource allocation and marketing strategies, respond promptly to customer behaviors such as upgrades or churn, and assess the effectiveness of sales and marketing efforts. MRR serves as a vital metric for investors, reflecting the company’s growth potential and market competitiveness. This ongoing analysis helps SaaS businesses adapt swiftly, optimize their services, and ensure sustained profitability in a dynamic market environment.

NPS (Net Promoter Score)
What is Net Promoter Score?
Net Promoter Score (NPS) operates as a litmus test for customer loyalty. By asking customers how likely they are to recommend a product or service on a scale from 0 to 10, businesses categorize respondents into promoters, passives, or detractors.

Why Do We Measure It?
The conventional NPS calculation method involves deducting the proportion of detractors from the proportion of promoters. To compute NPS, begin by posing the traditional NPS query, “On a scale from 0 to 10, how likely are you to recommend us?” For instance, if 70% of the respondents are promoters and 10% are detractors, you can compute the NPS as 60.
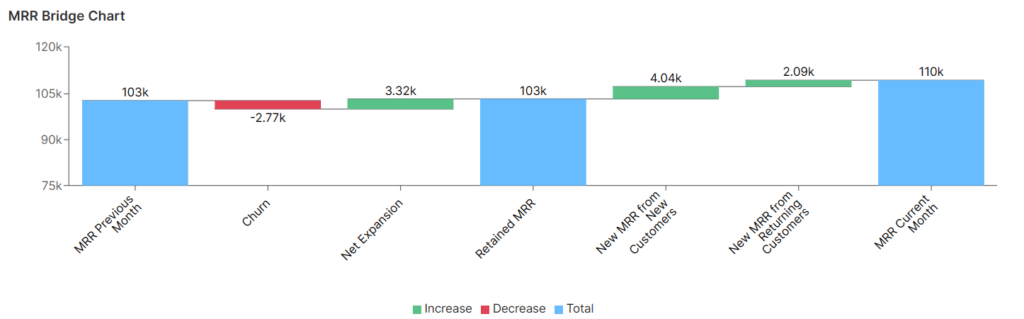
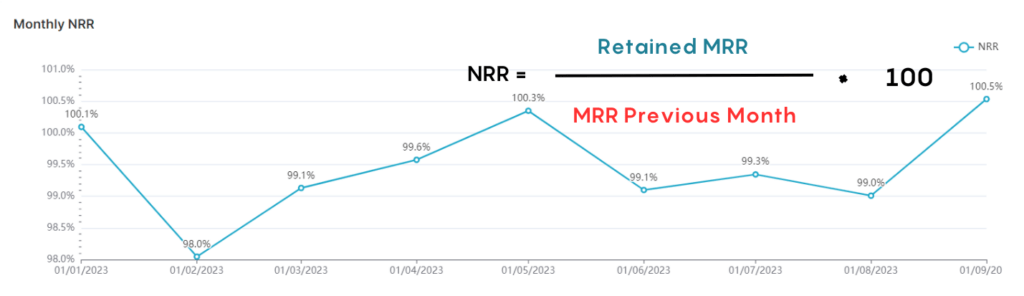
NRR (Net Revenue Retention)
What is Net Revenue Retention?
Net Revenue Retention (NRR) in 2024 is more than just a financial metric. It illustrates revenue growth from existing customers, encompassing expansions, churn, and contractions.
Why Do We Measure It?
In the competitive landscape of 2024, NRR provides a comprehensive view of customer relationships. A NRR above 100% signifies not only retaining existing revenue but also growing it organically. Businesses meticulously analyze NRR to adapt their strategies, ensuring customer satisfaction, and long-term revenue growth.
- NRR > 100% → Increased Recurring Revenue from Current Clients
- NRR <100% → Decreased Recurring Revenue Due to Churn and Downgrades
QLVR (Qualified Lead Velocity Rate)
What is Qualified Lead Velocity Rate?
Qualified Lead Velocity Rate (QLVR) in 2024 is a measure of the speed at which high-quality leads enter the sales funnel, emphasizing the importance of relevance over quantity. Likewise, it offers valuable insights into the growth potential of your customer base.
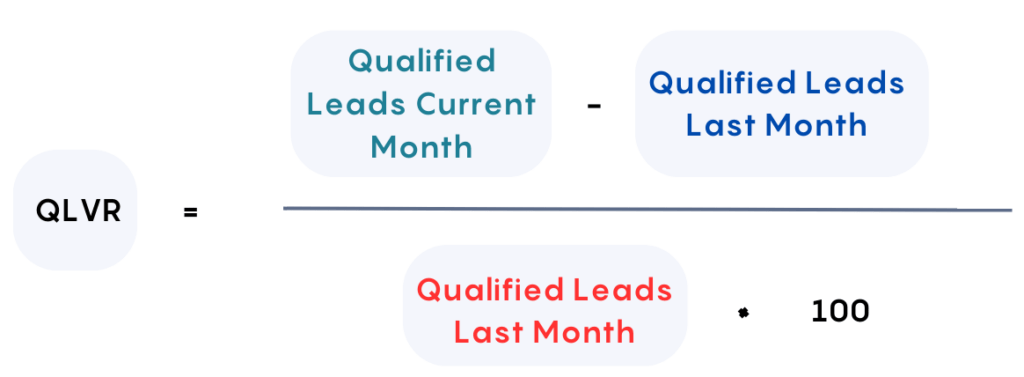
Why Do We Measure It?
In the bustling market scenario of 2024, QLVR becomes paramount. It ensures that the sales pipeline is consistently filled with leads with a high conversion potential. By focusing on quality over quantity, businesses optimize their resources, increase conversion rates, and drive revenue growth.
CAC (Customer Acquisition Cost)
What is Customer Acquisition Cost?
The Customer Acquisition Cost (CAC) is a crucial SaaS metric that quantifies the average expenditure a business incurs to acquire a new customer. CAC in 2024 goes beyond financial calculations; it represents the investment made in building relationships with potential customers. CAC encapsulates marketing campaigns, sales efforts, and customer onboarding expenses.

Why Do We Measure It?
In the bustling market of 2024, efficient allocation of resources is paramount. CAC analysis ensures that every amount spent on customer acquisition aligns with the long-term value these customers bring. By understanding CAC, businesses make informed decisions, ensuring sustainable growth and fostering enduring customer relationships.
→ For instance, if you invest €20 to acquire a customer, and that customer subsequently spends €60 on your brand, your CAC is €20 while the Customer Lifetime Value (CLV) is €60. This scenario indicates a positive return on investment, demonstrating the profitability of your customer acquisition efforts.
Customer Lifetime Value (CLV)
What is Customer Lifetime Value?
Customer Lifetime Value (CLV) in 2024 serves as a pivotal metric, representing the total revenue a business can anticipate from a customer over the entire duration of their relationship. Unlike immediate transactional values, CLV incorporates customer loyalty, repeat purchases, referrals, and overall engagement, providing a holistic view of a customer’s worth to a business.
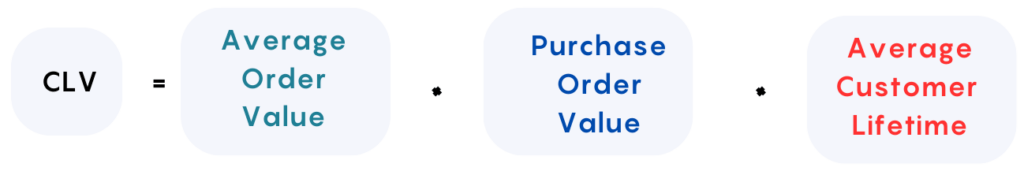
Why Do We Measure It?
In the ever-evolving market of 2024, CLV is more than just a number; it’s a strategic compass. By comprehensively understanding CLV, businesses can tailor their marketing efforts, enhance customer experiences, and focus on nurturing long-term relationships. CLV guides decisions related to product development, customer service, and loyalty initiatives, ensuring businesses invest in customer relationships that yield lasting value.
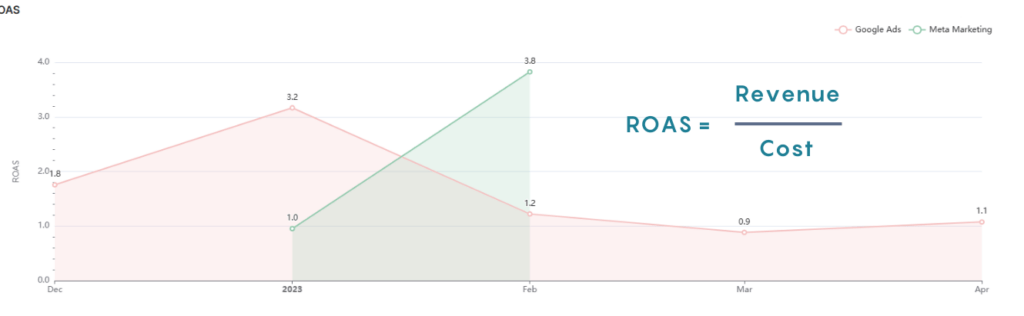
ROAS (Return on Advertising Spend)
What is Return on Advertising Spend?
Return on Advertising Spend (ROAS) in 2024 isn’t just about revenue; it’s about resonance. It assesses not only sales but also the engagement, brand loyalty, and customer sentiment generated by advertising efforts.
Why Do We Measure It?
In the digital age of 2024, targeted advertising is pivotal. ROAS evaluates the efficiency of advertising channels. It ensures that every advertising dollar invested doesn’t just generate immediate sales but also fosters meaningful customer connections, driving long-term brand loyalty and customer lifetime value.
NPS (Net Promoter Score)
What is Net Promoter Score?
Net Promoter Score (NPS) operates as a litmus test for customer loyalty. In addition, by asking customers how likely they are to recommend a product or service on a scale from 0 to 10, businesses categorize respondents into promoters, passives, or detractors.
Why Do We Measure It?
The conventional NPS calculation method involves deducting the proportion of detractors from the proportion of promoters. To compute NPS, begin by posing the traditional NPS query, “On a scale from 0 to 10, how likely are you to recommend us?” For instance, if 70% of the respondents are promoters and 10% are detractors, you can compute the NPS as 60.
Churn Rate
What is Churn Rate?
Churn Rate in 2024 measures the rate at which customers stop subscribing to a service, indicating customer attrition over a specific period. Moreover, it quantifies the percentage of existing customers in a SaaS company who have chosen to cancel their subscriptions or discontinue being customers within a specific time period.
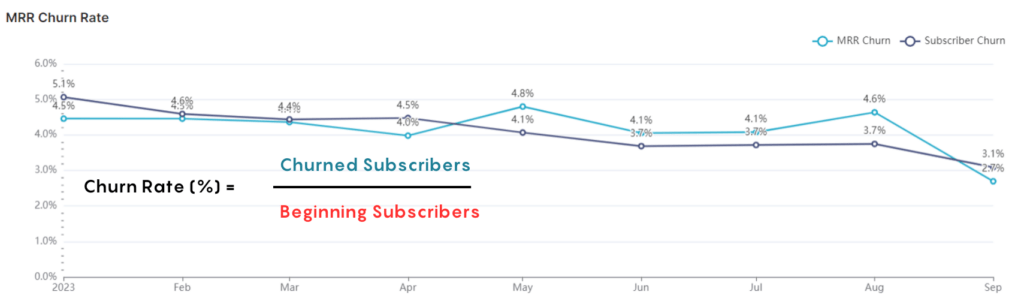
Why Do We Measure It?
In the competitive market of 2024, customer retention is paramount. Churn Rate acts as a warning signal. High churn rates can lead to revenue loss. So, by understanding and addressing churn reasons, businesses can enhance customer experiences, reduce attrition, and foster long-lasting relationships, ensuring a stable customer base and sustainable revenue.
Conclusion
In the fast-paced world of SaaS, where data reigns supreme, understanding these key metrics is not just a strategic advantage; it’s a necessity for survival and prosperity. As we navigate the intricate terrain of 2024, businesses must leverage these metrics as guiding stars, illuminating the path toward success. At Quantic, we understand the power of data.
Eventually, to embark on this transformative journey and explore the possibilities of data-driven success, visit Qmantic. Let your data tell the story of your success, guiding your decisions and shaping your future in the competitive realm of SaaS.