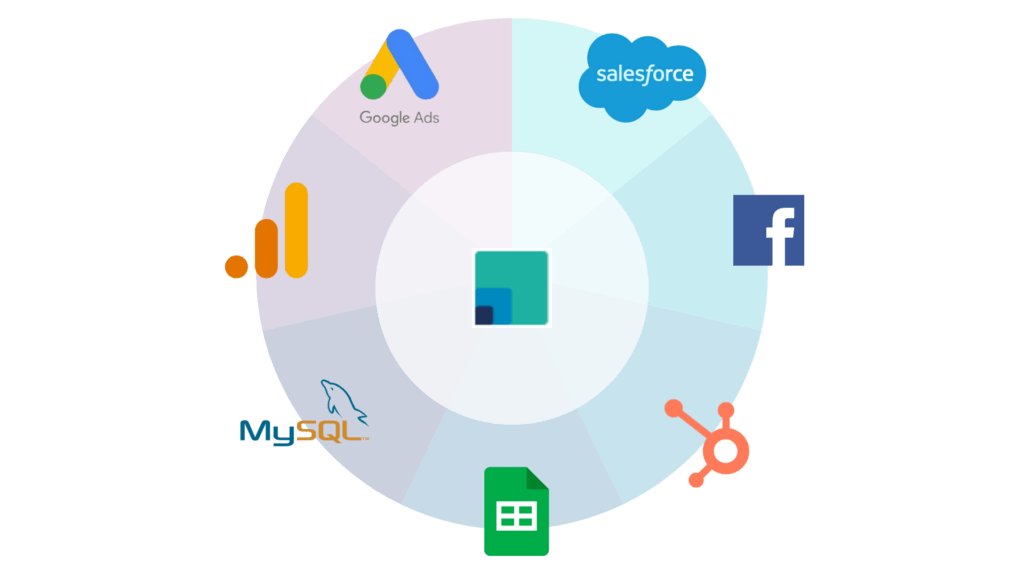
We combine top-performing, cost efficient data tools into a comprehensive all-in-one solution
Free trial. No credit card required.
What our Customers say


Dashboard Templates
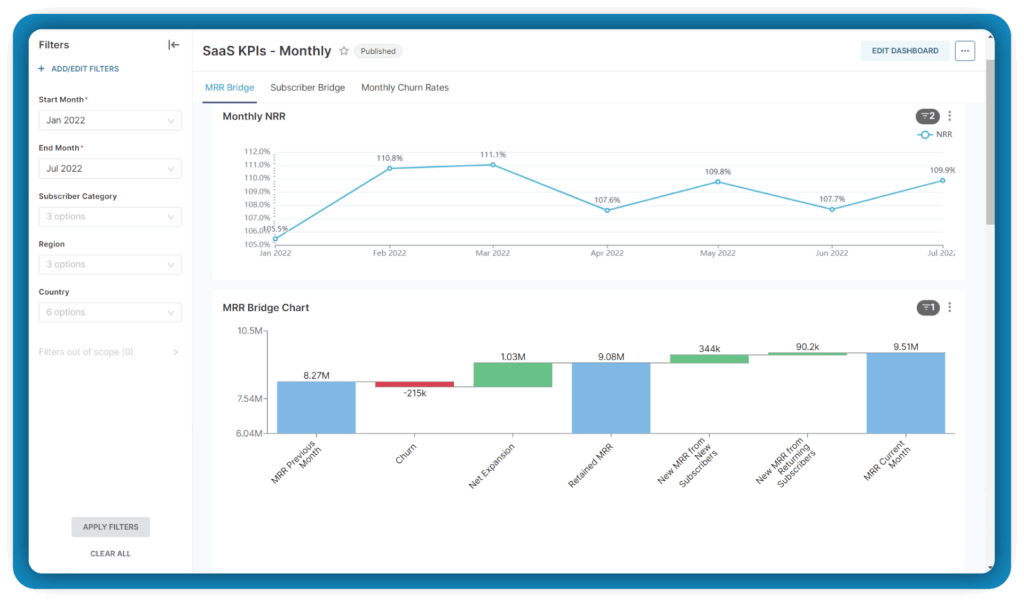
SaaS KPIs
Qmantic offers an immediate snapshot of your SaaS business. For example, our customizable MRR bridge chart allows you to view subscription performance details, including, FX effects, downgrades, upgrades, upsells, price changes, net new business, and churn.

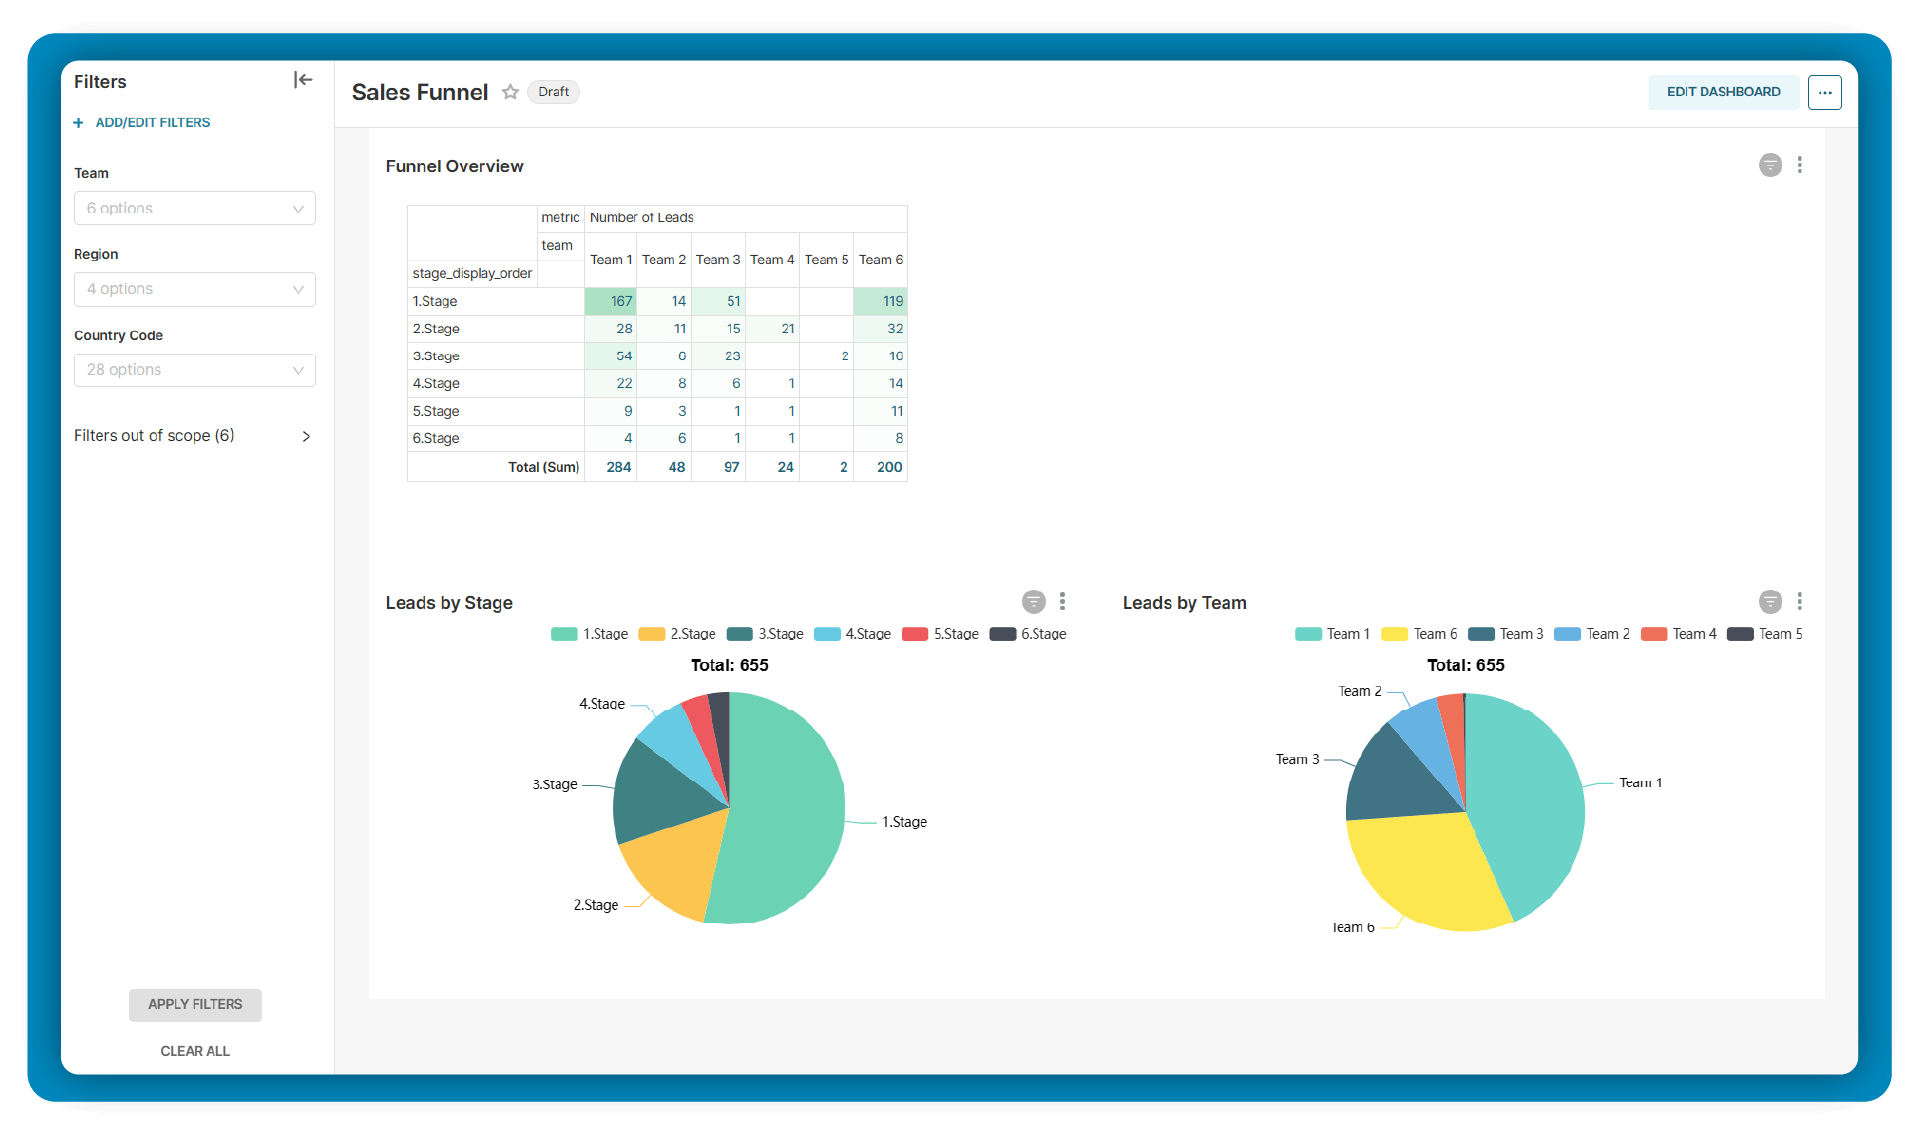
Sales Performance
The sales funnel is important to understand where your sales organization can improve. Qmantic offers a daily-updated overview customized to your own KPIs and metrics, allowing your sales leaders to quickly discern what to focus on and easily forecast sales.

Qmantic's Advanced Features at Your Fingertips
Cloud-Hosted
Qmantic is a Business Intelligence (BI) platform that helps businesses analyze their data easily. It’s hosted in the cloud, which means you don’t need to manage any servers or hardware. The platform uses Apache Superset, an open-source tool, to provide powerful data analysis features.
No Code Integrations
With Qmantic, you can move data from various apps and tools quickly using over 100 connectors. This means you can easily connect different software and transfer data without writing any code.
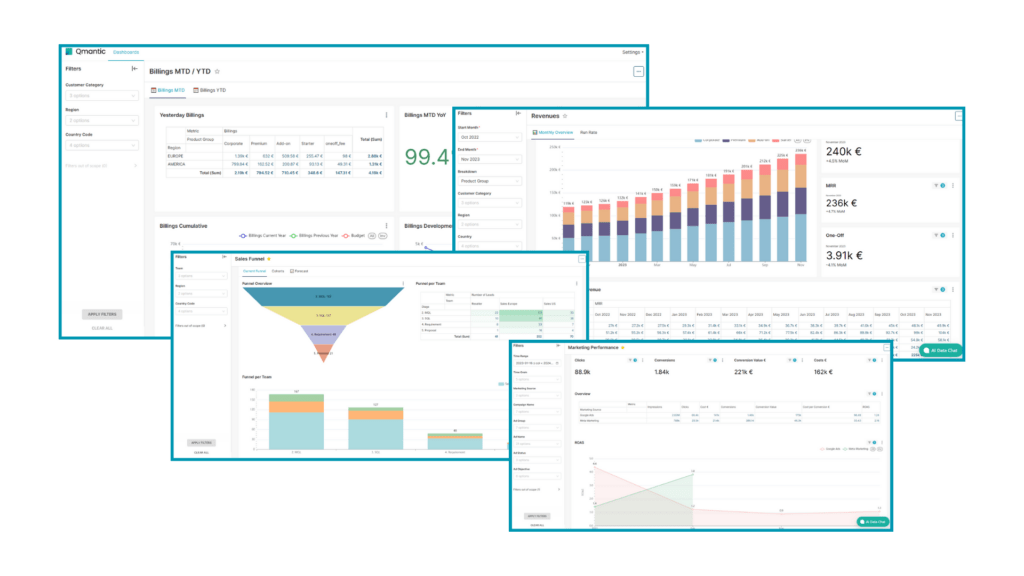
Dashboard Templates
Qmantic offers ready-to-use dashboard templates that help you get started quickly. You can choose from templates designed for Finance, Marketing, Sales, or general data, making it easy to visualize and understand your data right away.

AI Data Assistant
AI Data Assistant, named Phelina, you can chat with your data anytime. Phelina allows you to have natural, 24/7 conversations with your data, making it easy to get the information you need whenever you need it.
Gain Insights on Crucial Business Metrics with daily updates
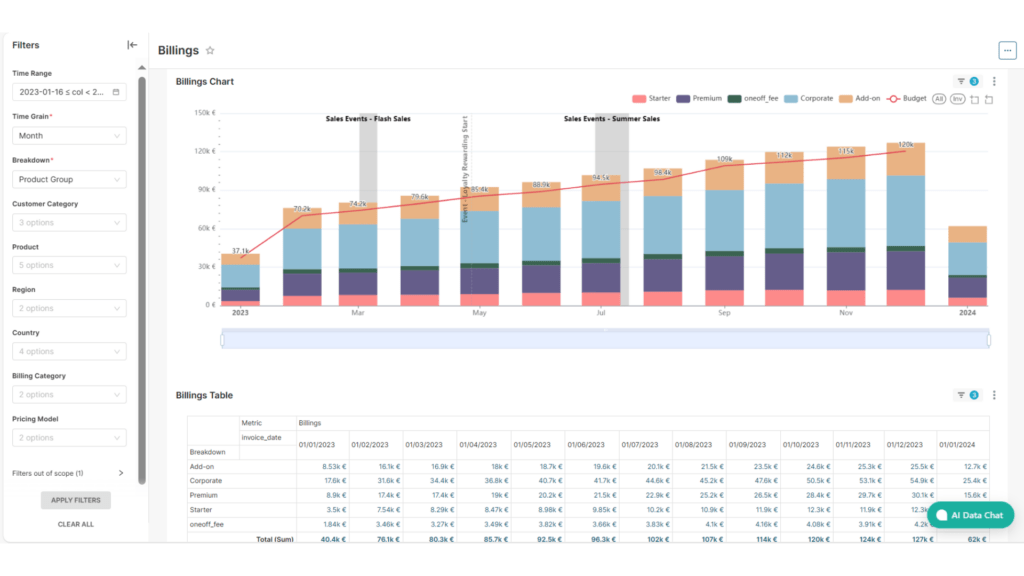
Revenue Trends
Understanding revenue trends is vital for any business, offering insights into customer behavior and market shifts. These patterns guide strategic decisions, highlighting growth areas and challenges. Enter Qmantic: more than just a tracking tool, it deciphers revenue data, turning it into actionable insights. With Qmantic, businesses don’t just see their earnings; they truly grasp their financial landscape, enabling informed strategies for a brighter future. In essence, Qmantic transforms raw revenue data into a roadmap for success.
Customer Acquisition Costs
Grasping customer acquisition costs (CAC) is crucial, as it directly impacts profitability and growth strategies. A clear understanding of CAC ensures efficient resource allocation and optimized marketing efforts. Qmantic elevates this understanding. Instead of mere numbers, Qmantic provides a deep dive into CAC, enabling businesses to pinpoint their most cost-effective strategies. With Qmantic, it’s not just about knowing the cost, but mastering the nuances of customer acquisition, setting the stage for sustainable growth.
Product Performance
Understanding product performance is pivotal for business growth. It reveals what resonates with customers and what needs refinement. A clear grasp of this drives innovation and market relevance. Qmantic amplifies this understanding. It doesn’t just present data; it offers insights into product strengths and areas for improvement. With Qmantic, businesses can delve deeper into product metrics, ensuring they’re always aligned with market demands and poised for success.
Regional Sales Data
Grasping regional sales data is essential, shedding light on market dynamics and customer preferences across geographies. It informs targeted strategies and optimizes resource allocation. Qmantic enhances this comprehension. Beyond just displaying data, Qmantic provides in-depth insights into regional sales trends, pinpointing areas of opportunity and growth. With Qmantic, businesses gain a sharper lens on their global footprint, ensuring they cater effectively to each region’s unique demands.
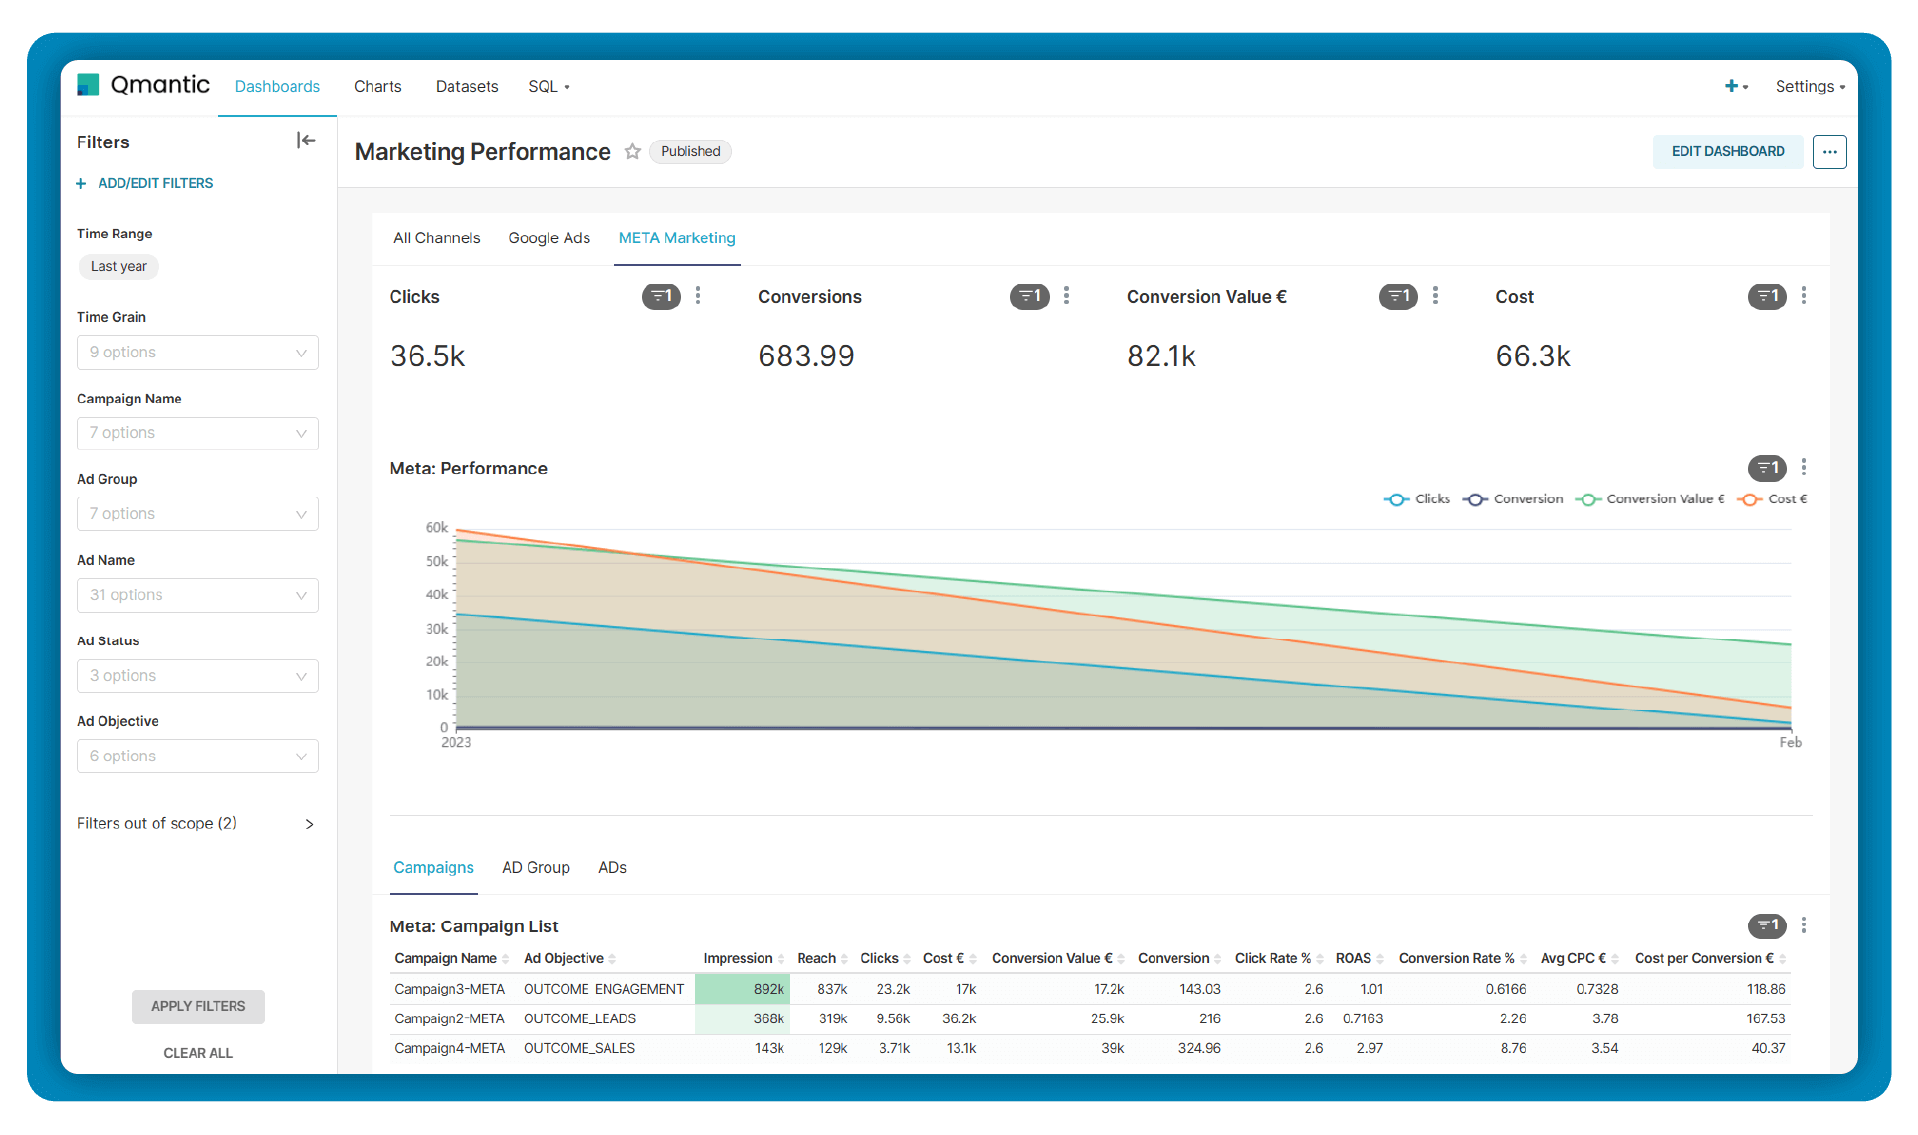
Marketing Performance
Understanding marketing performance and attribution is key to optimizing campaigns and maximizing ROI. It deciphers which strategies drive results and where investments yield returns. Qmantic elevates this insight. Instead of sifting through data, Qmantic offers clear analyses on marketing efficacy and source attribution. With Qmantic, businesses can fine-tune their strategies, ensuring every marketing dollar is effectively spent and every success accurately attributed.
Get Connected
Create your free Qmantic account now to check it out yourself.
We created a live reporting environment with demo-data where you can experience some of the basic dashboards. These are dashboards that are typically filled with your own data to form a starting point for your BI project.