Making informed judgments in today’s data-driven environment requires the capacity to glean useful insights from massive volumes of data.
Raw data alone can be overwhelming and challenging to comprehend, which is where data visualization comes into play. Visualizing data through various chart types not only enhances understanding but also enables quick identification of patterns, trends, and outliers. Effective data visualization empowers businesses to communicate insights, drive strategic initiatives, and unlock hidden opportunities. In this article, we will explore the importance of utilizing different types of charts and how Qmantic, a leading BI platform, offers a range of powerful visualization tools to help you leverage the full potential of your datasets.

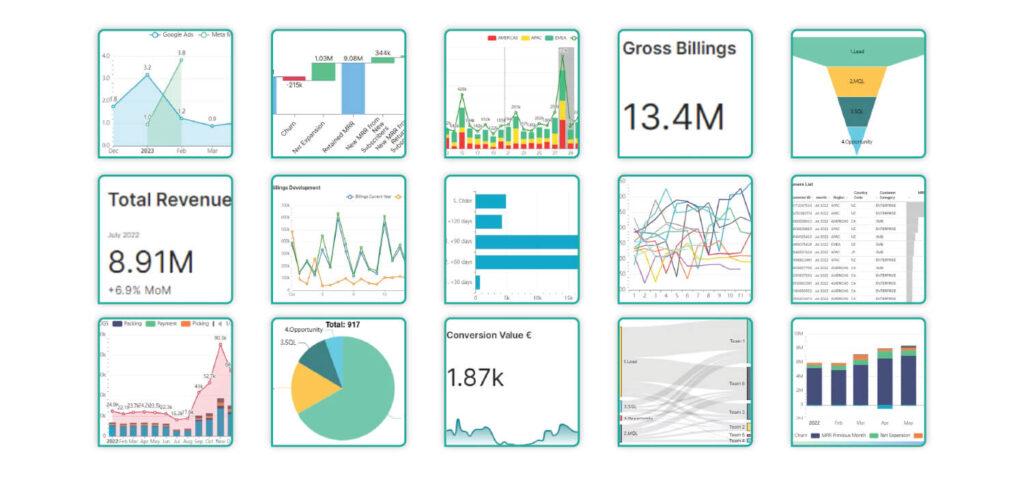
These different categories of charts offer a range of visualization options to effectively analyze, compare, distribute, and track data, empowering decision-making and insights in various fields and industries.
Let’s observe the major categories!
🔹 Comparison Charts
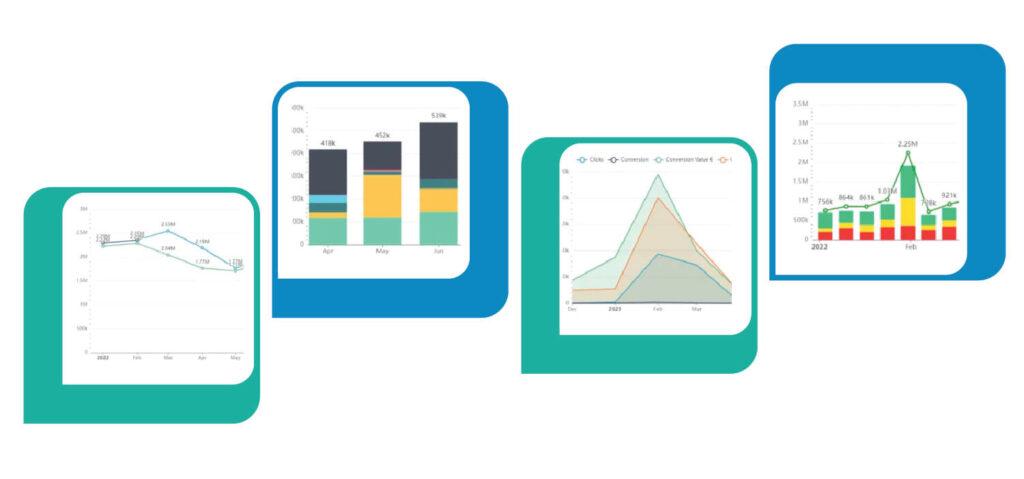
Line Chart, Bar Chart, Area Chart, Mixed Chart, Table, Pivot Table
Comparison charts are powerful tools for visualizing and analyzing data sets by highlighting similarities, differences, and trends among different categories or variables. Line charts are ideal for tracking trends over time, while bar charts and area charts are effective in comparing categorical data and showcasing value distributions. Moreover, mixed charts allow the combination of multiple visualization types, providing a comprehensive display of diverse data sets. Tables and pivot tables offer organized and structured views of data, facilitating easy comparison, sorting, and filtering.
🟩 Distribution Charts
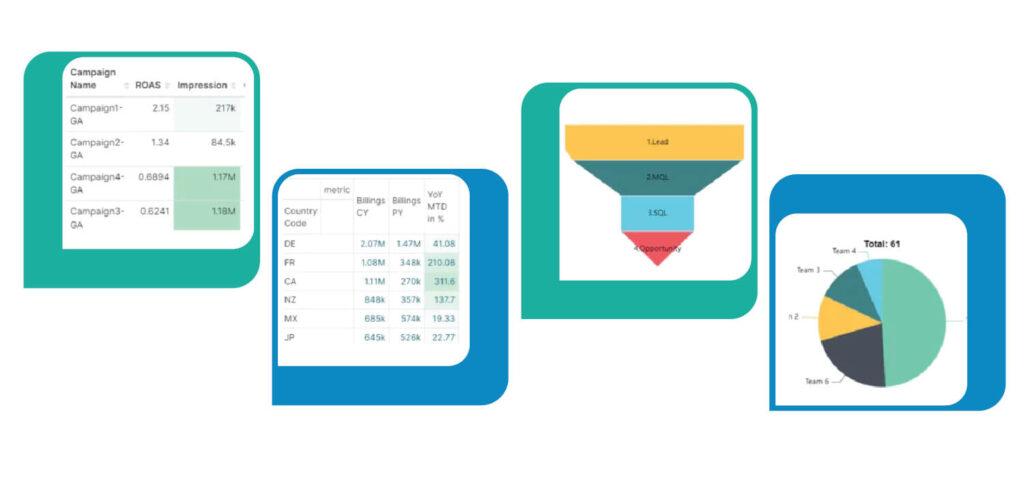
Funnel Chart, Pie Chart
Distribution charts focus on presenting the distribution or proportionality of data categories. Funnel charts are commonly used to visualize sequential processes and track conversion rates, providing insights into the progressive reduction. Furthermore, Pie charts are effective in displaying proportions and percentages, enabling quick comprehension of data distribution and relative shares among categories.
🔺 Progression Charts
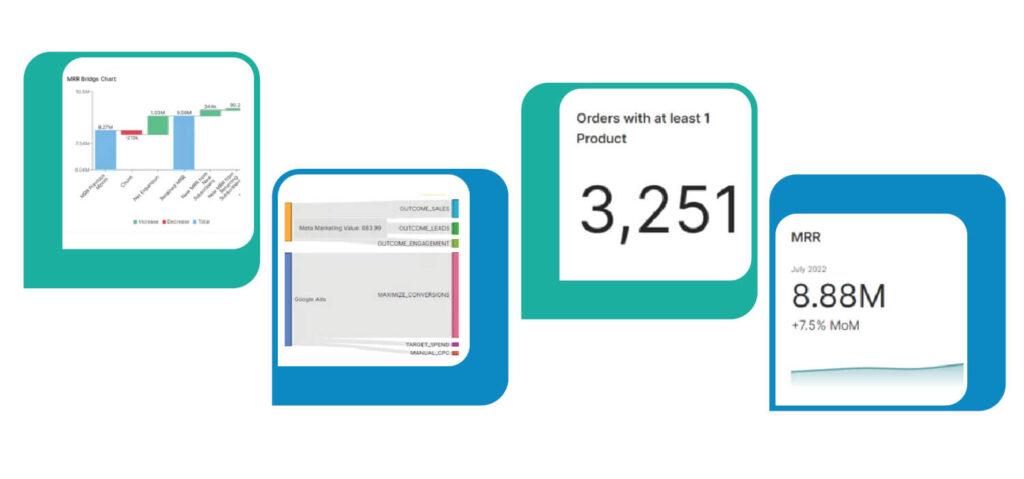
Waterfall Chart, Sankey Diagram, Big Number, Big Number with Trendline
Progression charts, for instance, are designed to showcase the progression or cumulative effect of data points or key metrics. In addition, waterfall charts illustrate the additive or subtractive contributions to a total value, making them particularly useful for analyzing financial statements, project budgets, or profit margins. Moreover, Sankey diagrams visualize the flow and relationships between entities, offering valuable insights into the intensity, direction, and potential bottlenecks of processes. Furthermore, big numbers and big numbers with trendlines focus on highlighting a single key metric or value, providing a concise yet comprehensive representation of important figures over time.
🔹 Line Chart
A line chart is a powerful visualization tool for tracking trends over time. By plotting data points and connecting them with lines, it allows you to observe patterns, identify fluctuations, and gain valuable insights. Whether you’re analyzing sales performance, website traffic, or stock prices, the line chart provides a clear and intuitive representation of data dynamics.
🔹 Bar Chart
Bar charts are ideal for comparing categorical data or showcasing value distributions. With vertical or horizontal bars, this visualization type allows you to easily identify highs and lows, spot anomalies, and make data-driven decisions. Whether you’re presenting sales by region or survey responses by category, the bar chart simplifies complex information into visually appealing and digestible form.
🔹 Area Chart
Area charts are valuable for showcasing cumulative data trends. By filling the space between a line and an axis, they help you understand the magnitude of individual data points as well as the overall volume over time. Whether you’re analyzing population growth, revenue accumulation, or web traffic patterns, area charts bring clarity and depth to your insights.
🔹 Mixed Chart
Mixed charts allow you to combine multiple visualization types into a single comprehensive display. This versatile tool enables you to present diverse data sets, compare different metrics, and convey complex relationships in a visually appealing manner. Whether you’re integrating bar charts, lines, areas, or any other visual elements, mixed charts empower you to create dynamic and impactful visualizations.

🔹 Table
Tables provide a neat and organized format for presenting structured data. They display rows and columns of information, making it easy to compare values, sort data, and apply filters. Whether you’re presenting sales figures, survey responses, or employee performance metrics, tables offer a clear and systematic view of your data.
🔹 Pivot Table
Pivot tables, on the other hand, are powerful tools for analyzing and summarizing large datasets. They not only allow you to aggregate and cross-tabulate data but also perform calculations and apply filters to explore different dimensions. By effortlessly dragging and dropping fields, you can swiftly transform raw data into meaningful insights. Additionally, pivot tables are particularly useful for data exploration, pattern recognition, and making data-driven decisions.
🟩 Funnel Chart
Funnel charts are ideal for visualizing sequential processes and tracking conversion rates. They represent the progressive reduction or progression of data points as they move through different stages. Whether you’re analyzing sales pipelines, website user journeys, or marketing campaigns, funnel charts help identify bottlenecks, optimize conversions, and improve overall efficiency.
🟩 Pie Chart
Pie charts are perfect for displaying proportions and percentages. They represent data in a circular form, with each slice representing a category and its size indicating its relative share. This visualization type enables quick comprehension of data distribution and is particularly useful for displaying market shares, survey results, and budget allocations.

🔺 Waterfall Chart
Waterfall charts help understand the cumulative effect of positive and negative contributions to a total value. They display a series of floating columns that depict changes in value as individual factors are added or subtracted. Whether you’re analyzing financial statements, project budgets, or profit margins, waterfall charts enable a detailed breakdown of data and facilitate effective decision-making.
🔺 Sankey Diagram
Sankey diagrams are versatile tools for visualizing flow and relationships between entities. With interconnected paths and variable-width arrows, this visualization type illustrates the movement of quantities, such as energy flow, product supply chains, or website user journeys. Sankey diagrams reveal the intensity, direction, and potential bottlenecks of processes, enabling efficient optimization and decision-making.
🔺 Big Number
Big number visualizations focus on highlighting a single key metric or value. They provide a visually impactful representation of important figures, such as revenue, profit, or customer count. By emphasizing key performance indicators, big number visualizations enable quick comprehension and immediate attention to critical business metrics.
🔺 Big Number with Trendline
Combining a big number with a trendline offers a concise yet comprehensive representation of a key metric. The big number prominently displays a single value, such as total sales or website visitors, while the trendline visualizes its historical progression. This visualization type is ideal for providing at-a-glance insights and tracking performance over time.

Discover Visualization with Qmantic
Incorporating these diverse visualization types in your data analysis toolkit can greatly enhance your ability to communicate insights effectively. To explore these visualizations further and experience their capabilities firsthand, you can book a demo of the Qmantic platform. Discover how Qmantic can help you unlock the full potential of data visualization for your business.
For specific details on the chart types supported by the Qmantic platform and how they visualize datasets, you can discover by visiting here🔍, there, you will likely find detailed information about the chart types available and how Qmantic visualizes datasets to provide meaningful insights.


