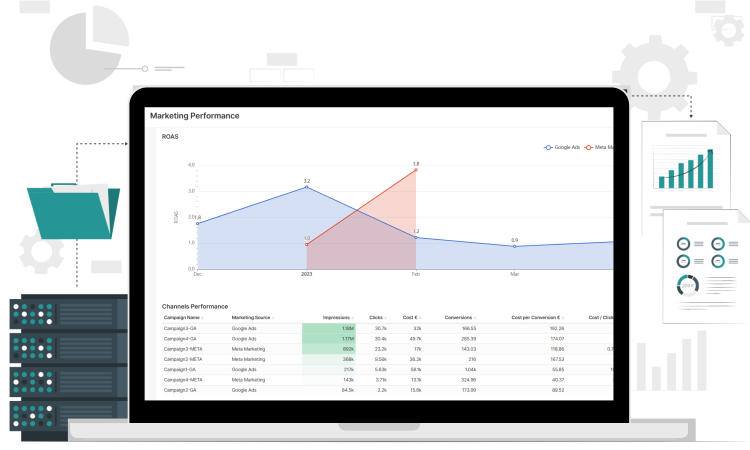
![The line chart represents (ROAS) over time, showing the performance trends. The table includes information about various marketing channels, such as impressions, clicks, conversions, and conversion rates.](https://qmantic.com/wp-content/uploads/2023/06/3-2.png)
Blog
![Enea Koci](https://qmantic.com/wp-content/litespeed/avatar/cdb5ed129f05ae13b65a6be98fab1c92.jpg?ver=1721891792)
Data Visualization: Beyond Raw Analysis
Data visualization is an indispensable process that transforms complex data sets into visual representations, such as charts, graphs, and maps. By doing so, it enables