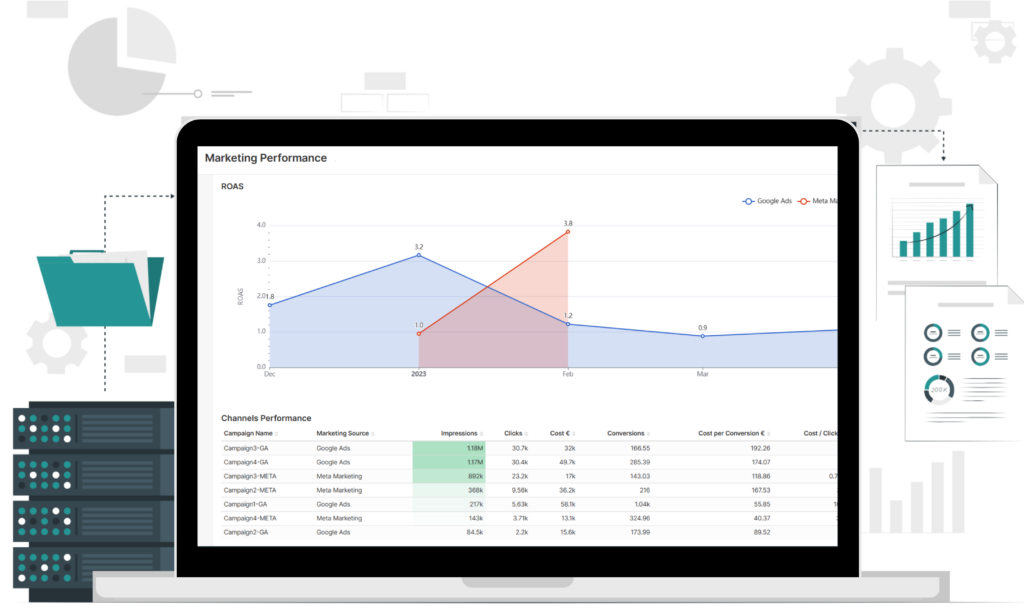
Data visualization is an indispensable process that transforms complex data sets into visual representations, such as charts, graphs, and maps. By doing so, it enables individuals to discern patterns, trends, and correlations that might otherwise go unnoticed. This article explores the importance of data visualization and how it goes beyond presenting data, facilitating a deeper understanding and enhancing decision-making.

What is Data Visualization?
Data visualization is the process of representing data and information visually through charts, graphs, maps, and other visual elements. It transforms complex datasets into intuitive and interactive visual representations, allowing individuals to grasp patterns, trends, and correlations that might otherwise go unnoticed.
Data visualization combines the art and science of storytelling, enabling the audience to absorb information quickly and comprehend the significance of the data being presented. It goes beyond mere data representation; it brings the data to life and allows for a deeper level of understanding.
Why is Data Visualization Important?

1. Simplifying Complexity
Raw data, in its unprocessed form, can be overwhelming and challenging to comprehend. Visualization of Data simplifies complexity by presenting information in a visually appealing and digestible format. It enables users to explore and interpret data effortlessly, even if they lack specialized technical skills.
2. Spotting Patterns and Trends
By visualizing data, patterns, trends, and relationships become more apparent. Whether it’s identifying sales trends, customer behavior patterns, or market fluctuations, data visualization facilitates the detection of valuable insights that may remain concealed within tabular data.
3. Enhancing Decision Making
Visual representations of data help individuals make informed decisions more effectively. By presenting complex information in a visual format, data visualization enables decision-makers to grasp the big picture, evaluate different scenarios, and understand the potential consequences of their choices.
4. Improving Communication
The visualization of data is a powerful tool for conveying information to diverse audiences. It simplifies the communication of complex ideas, enabling data-driven stories to be shared and understood by stakeholders, clients, or the general public. Visualizations can transcend language barriers and resonate with people on a universal level.
Going Beyond Raw Data: Aggregate, Slice, Dice, and Drill-Down

Visualization offers far more than just presenting data visually. It empowers users to interact with data actively and extract meaningful insights by leveraging various techniques such as aggregation, slicing, dicing, and drill-down.
1. Aggregation
Data can be aggregated to summarize large volumes of information into more manageable and understandable units. Aggregating data helps to identify high-level trends and patterns, providing a bird’s-eye view of the data.
2. Slicing and Dicing
Slicing and dicing involve breaking down data into smaller subsets based on specific criteria or dimensions. This technique allows users to explore data from different angles and perspectives, uncovering hidden relationships and trends that might be obscured in the original dataset.
3. Drill-Down
Drill-down enables users to navigate from a high-level overview to detailed information by interactively exploring the data hierarchy. It facilitates a granular analysis of data, helping users investigate specific data points or outliers and gain a deeper understanding of the underlying factors influencing the results.
Leveraging Qmantic: Insights as a Service
To make visualization of data even more powerful and accessible, harnessing the capabilities of Qmantic, an advanced insights-as-a-service platform. Qmantic allows users to collect, link, and analyze data from various sources, creating a unified view of their data ecosystem. It offers a range of tools and features specifically designed to support visualization, enabling users to create compelling and interactive visualizations.
By combining the capabilities of Qmantic with data visualization techniques, organizations can unlock the full potential of their data, gain a competitive edge, and make data-driven decisions with confidence.


