What is an ETL Process?
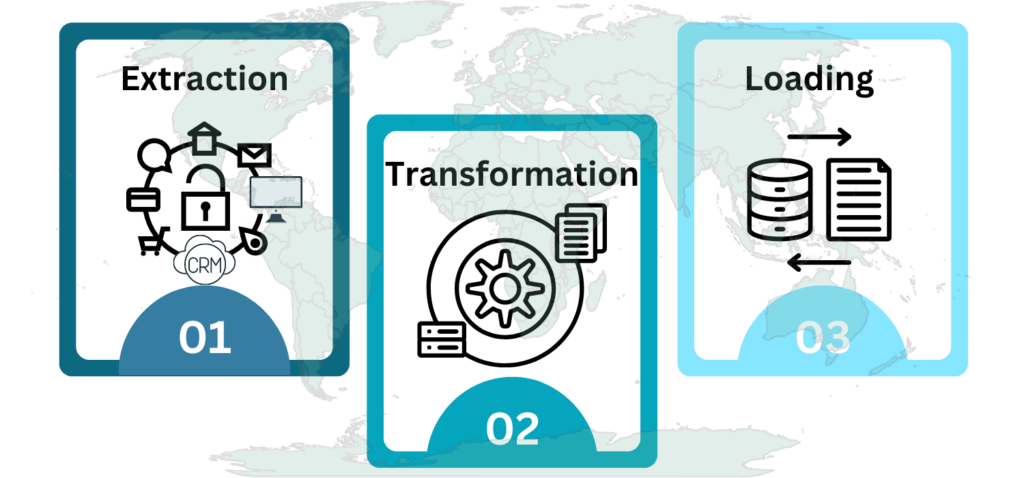
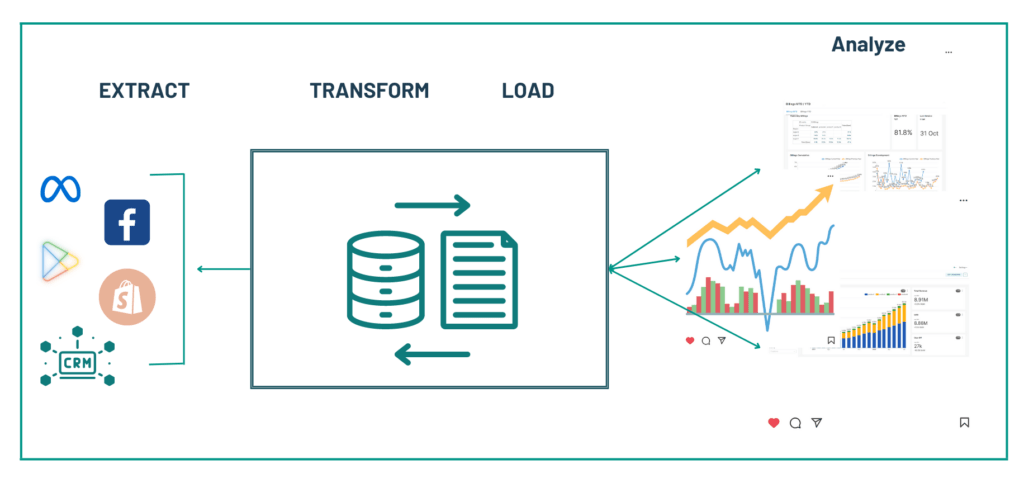
ETL stands for Extract, Transform, Load, and it refers to a data integration process used in the field of data warehousing and BI. The ETL process includes extracting data from various sources, transforming it into a suitable format, and loading it into a destination system, such as a data warehouse or a database, for further analysis and querying.
The ETL process is crucial in data-driven decision-making and BI because it enables organizations to consolidate data from disparate sources into a centralized repository, ensuring data consistency and providing a single version of truth for analysis and reporting.
In recent years, with the advent of big data and real-time analytics, we’ve seen the emergence of variations on the traditional ETL process, such as ELT (Extract, Load, Transform). In ELT, the initial step involves loading data into the target system, followed by transformation within the data warehouse using distributed processing frameworks.
How ETL Works?
The ETL process comprises three steps in data integration, intended for moving and preparing data for analysis and reporting. Let’s explore each step in detail:
Extraction
The first step in ETL is extraction. We collect data from various sources, including databases, spreadsheets, applications, logs, and even web services. Businesses often deal with a multitude of systems and databases, and the ETL process brings together data from these disparate sources into a centralized repository.
⇨ Identify Data Sources
The first step is to identify the data sources from which data needs to be extracted. These sources could be databases, files, APIs, web services, spreadsheets, or other systems containing relevant data.
⇨ Connect to Data Sources
ETL professionals use ETL tools or scripts to connect to the data sources and retrieve the necessary data. The connection method varies depending on the type of data source and the specific ETL tool in use.
⇨ Extract Data
Data is extracted from the source systems and staged in a temporary storage area known as a staging area. The staging area helps in data cleansing and handling any issues that may arise during the extraction process.
Transformation
After extraction, the data needs to be transformed into a consistent and usable format that matches the target data model. Transformation involves operations like data cleansing to eliminate errors and inconsistencies, normalization to standardize data, and enrichment to enhance data quality. During this phase, we structure and format data in a way that facilitates analysis and decision-making.
⇨ Data Cleansing
In this step, we cleanse and standardize data to remove duplicates, correct errors, handle missing values, and ensure data integrity.
⇨ Data Validation
Data is validated to check for any inconsistencies or anomalies. For example, ensuring that numeric values are within a valid range or that data adheres to specific rules.
⇨ Data Transformation
To match the requirements of the destination system, it may be necessary to transform data into a consistent format. This can involve converting data types, aggregating data, or splitting data into multiple tables, among other operations.
⇨ Data Enrichment
You can enhance the existing data with more information by incorporating additional data from external sources.
⇨ Business Rules and Calculations
Data may undergo various business logic and calculations to derive new metrics or indicators required for analysis.
Loading
After transforming the data, we load it into a data warehouse, database, or another destination where business intelligence tools and reporting platforms can easily access it. The loading phase aims to store the processed data in an organized and efficient manner, ready for further analysis and visualization.
⇨ Data Staging
Transformed data is staged and stored in a format suitable for loading into the target data warehouse or database. This staging area helps in optimizing the loading process and avoids directly impacting the production database.
⇨ Data Loading
We load data from the staging area into the target data warehouse or database. However, depending on the ETL process and the data warehouse architecture, we can perform this loading in batch or real-time.
⇨ Indexing and Optimization
In the target data warehouse, we create indexes and data structures to optimize query performance and facilitate efficient data retrieval.
⇨ Refresh Frequency
The frequency of the ETL process may vary depending on the data update frequency and business requirements. While some data warehouses receive daily updates, others are updated in real-time.
Typical Sources for ETL
The ETL process draws data from a wide range of sources, including but not limited to:
➛ ERP (Enterprise Resource Planning) Systems
Centralized databases manage various business processes and transactions across different departments, including finance, inventory, and human resources. ERP systems, such as SAP, Oracle E-Business Suite, and Microsoft Dynamics, contain critical business data related to finance, inventory, procurement, and other operational aspects. ETL processes can extract data from these systems to provide insights into business processes and performance.
➛ CRM (Customer Relationship Management) Systems
CRM platforms are used to manage interactions with customers, including sales, support, and marketing activities. CRM systems like Salesforce, HubSpot, and Zoho CRM store customer-related data, including contact information, interactions, sales opportunities, and customer support tickets. ETL processes can extract this data for customer analysis and improving customer relationships. Extracting and integrating data from CRM systems can provide valuable insights into customer behavior and preferences.
➛ Marketing (MKT) Platforms
ETL allows businesses to gather data from various marketing channels and campaigns, enabling a comprehensive view of marketing efforts and their impact on customer engagement and conversions. Marketing automation platforms (e.g., Marketo, HubSpot Marketing Hub) and advertising platforms (e.g., Google Ads, Facebook Ads) generate vast amounts of marketing data, such as campaign performance, click-through rates, and customer behavior. ETL processes can collect and transform this data to measure marketing ROI and optimize strategies.
➛ Website Tracking
Website tracking tools like Google Analytics capture valuable data on website visits, user behavior, and online interactions. Integrating this data into the ETL process can provide actionable insights to optimize website performance and marketing strategies.
Data Warehouse ETL process

The Data Warehouse ETL process is a crucial component of data management and analytics. Moreover, it entails moving and transforming data from various sources into a data warehouse, where users can utilize it for reporting, analysis, and generating dashboards. To provide an overview of how the ETL process works:
① Extract (E)
Sources: We extract data from various source systems, which may include databases, applications, external APIs, flat files, and more. These sources can take the form of structured data (such as relational databases) or unstructured data (like log files).
② Transform (T)
Data Transformation: This is a critical step where data is cleaned, normalized, and transformed to make it suitable for analysis. Common transformations include:
Data cleansing is crucial for handling missing values and inconsistencies. To combine data from multiple sources, data integration is essential. Furthermore, comprehensive understanding, consider data enrichment through context or calculated fields. Additionally, data aggregation helps in creating summary datasets.
Data Quality: Quality checks and validation are performed to ensure data accuracy and consistency.
③ Load (L)
Data Warehouse: Transformed data is loaded into a data warehouse, which serves as a centralized repository optimized for querying and reporting. Popular data warehousing solutions include Snowflake, Amazon Redshift, Google BigQuery, and Microsoft Azure Synapse Analytics.
Data Modeling: The data warehouse organizes data into dimensional or star schemas. This design facilitates efficient querying and reporting. Dimensions represent business entities (e.g., customers, products), and facts contain the measurable data (e.g., sales, revenue).
④ Datasets and Dashboards
Create datasets or data sources within your BI tool. These datasets are virtual representations of your data tables in the data warehouse. So, you can perform further transformations or calculations specific to the dashboard within these datasets.
Use the BI tool’s interface to design your dashboards. You can drag and drop visual elements like visualizations, charts, graphs, and tables to analyze and present the data.
⑤ User Access
End-Users: Business analysts, data scientists, and decision-makers access the dashboards and reports to gain insights, monitor KPIs, and make informed decisions.
⑥ Monitoring and Maintenance
The ETL process typically automates and schedules itself to run at regular intervals (e.g., nightly or hourly). Ongoing monitoring ensures data quality, system performance, and error handling. Maintenance includes updates to accommodate changes in source systems or evolving business requirements.
💡 Your All-in-One ETL
In today’s dynamic data landscape, ETL processes continue to evolve to meet the demands of businesses seeking timely, accurate insights. If you’re looking for a comprehensive ETL and Business Intelligence solution, Qmantic is the answer. Moreover, Qmantic seamlessly integrates powerful tools like Airbyte for data extraction and DBT for transformation, all within a unified platform. This hosted service in the cloud empowers organizations to efficiently orchestrate their data workflows and unlock the full potential of their data for informed decision-making. Whether you choose Qmantic or explore other innovative solutions, the key remains the same: unlocking the value hidden within your data for a competitive edge in today’s data-driven world.


